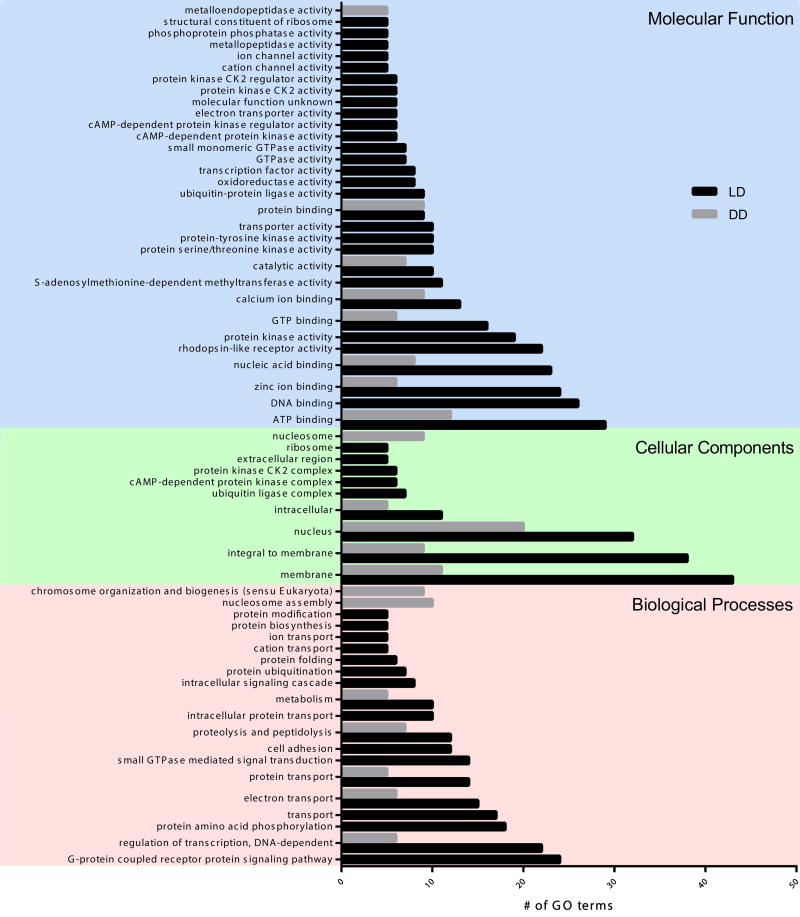
Fig. 4. Enriched Gene Ontology (GO) Category Distribution of DEG.
Classification of DEGs in LD (black bars) and DD (grey bars) treatment by Gene Ontology (GO) annotations and categorized into three main categories: biological processes, cellular component, and molecular function. A total of 340 genes were assigned GO terms in LD and 144 were assigned GO terms in DD. GO accession numbers are listed in Supplementary Figure 7. *There were no genes in LD18 vs. DD18 included for these comparisons (see Results).

