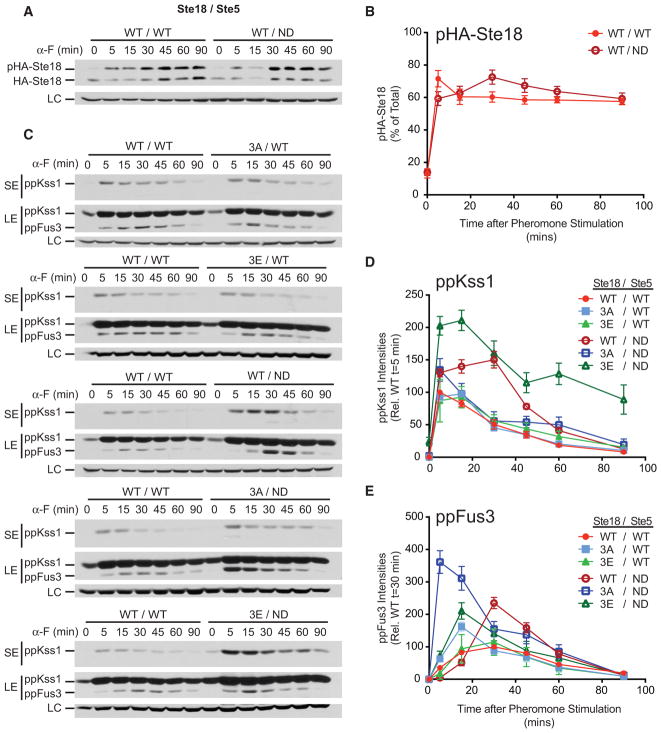
Figure 3. Phosphorylation on Ste18 and Ste5 Cooperate to Prevent Early and Maximal Fus3 Activation.
Cells harboring the indicated combination of wild-type or mutant versions of Ste18 and Ste5 were stimulated with 3 μM α-F followed by quantitative immunoblot analysis of HA-Ste18 or activated Fus3 and Kss1.
(A) HA-Ste18 immunoblot in cells harboring wild-type (WT/WT) or Ste5ND (WT/non-docking [ND]).
(B) Quantitative comparison of pHA-Ste18 from (A) (n = 4).
(C) Representative immunoblot for activated Kss1 and Fus3.
(D) Quantitative comparison of activated Kss1 relative to wild-type peak activation at 5 min from immunoblots shown in (C).
(E) Quantitative comparison of activated Fus3 relative to wild-type peak activation at 30 min from immunoblots shown in (C). Data represent mean ± SD; n = 12. SE, short exposure; LE, long exposure; LC, loading control.
See also Figures S3, S4, and S5 and Table S2.

