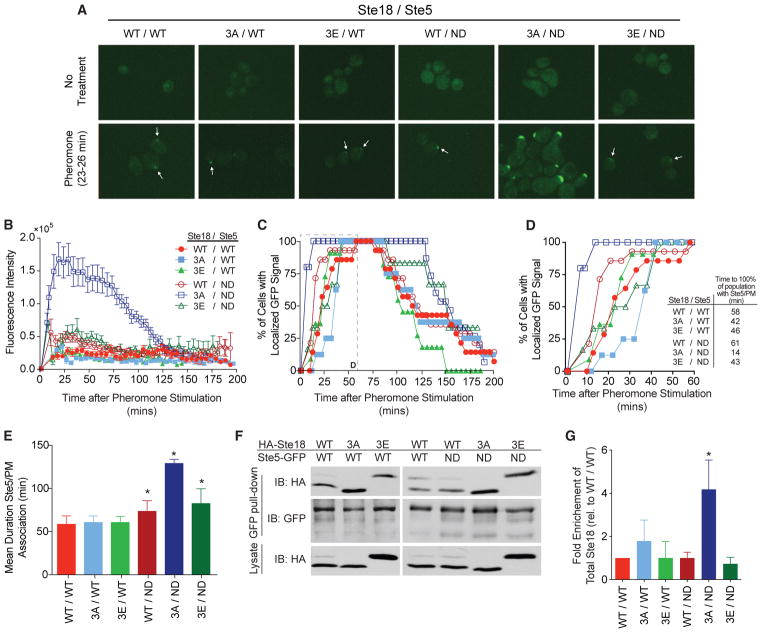
Figure 4. Phosphorylation on Ste18/Ste5 Regulates the Rate and Duration of Ste5 Association at the Plasma Membrane.
Cells expressing phosphorylation mutants of Ste18 with either Ste5-GFP or Ste5ND-GFP were treated with α-factor to examine Ste5 localization by fluorescence microscopy (see Experimental Procedures).
(A) Representative fluorescent images showing cells with localized GFP signal at the membrane before (top) or 23–26 min post-pheromone treatment (bottom).
(B) Quantification of total Ste5-GFP fluorescence at the shmoo tip in cells treated with pheromone.
(C) Time-resolved percentage of the cell population with Ste5-GFP localized at the plasma membrane in response to pheromone stimulation. Inset is indicated with a dashed line.
(D) Zoomed view of the first 60 min from (C, inset). Time required before 100% of all cells display Ste5-GFP at the shmoo tip is indicated.
(E) Mean duration of Ste5-GFP/PM association (at the site of an emerging or extant mating projection).
(F) Immunoblot showing coIP of HA-Ste18 with Ste5-GFP from pheromone-treated cells. The lysate shown is 4% of the total lysate used for coIP (Experimental Procedures).
(G) Quantitative analysis of immunoblots from coIP in (F). Bars represent fold enrichment of total HA-Ste18 relative to wild-type.
Data represent mean ± SD; n = 3. All microscopy data represent GFP signal scored in 8–14 cells, with error bars depicting SEM in (B).
See also Figure S6.

