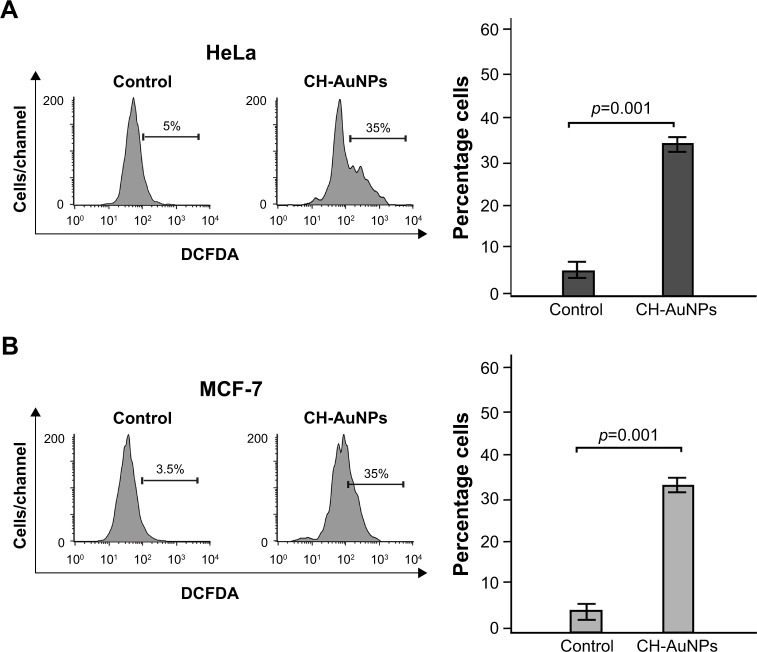
Figure 8.
ROS production in HeLa and MCF-7 cells upon treatment with CH-AuNPs.
Notes: ROS levels were measured by flow cytometry through DCFDA staining in HeLa (A) and MCF-7 (B) cells left alone or treated with CC50 of CH-AuNPs for 24 hours (left). Data were then analyzed and graphed (right).
Abbreviations: CH-AuNPs, chitosan gold nanoparticles; DCFDA, dichlorodihydrofluorescein diacetate; ROS, reactive oxygen species.

