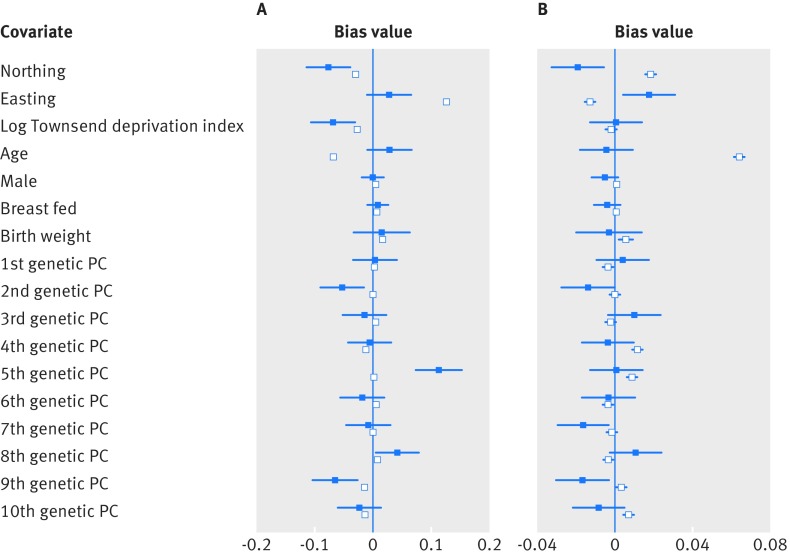
Fig 4.
Confounding bias plots. Plots showing relative bias in instrumental variable estimate (blue) and standard multivariable regression estimate (white) from potential confounders including: place of birth (northing and easting coordinates), Townsend deprivation index, age, sex, breastfed, birth weight, and first 10 genetic principal components (PC), when (A) estimating the effect of time spent in education on refractive error; and (B) estimating the effect of refractive error on time spent in education. Townsend deprivation index was natural log transformed

