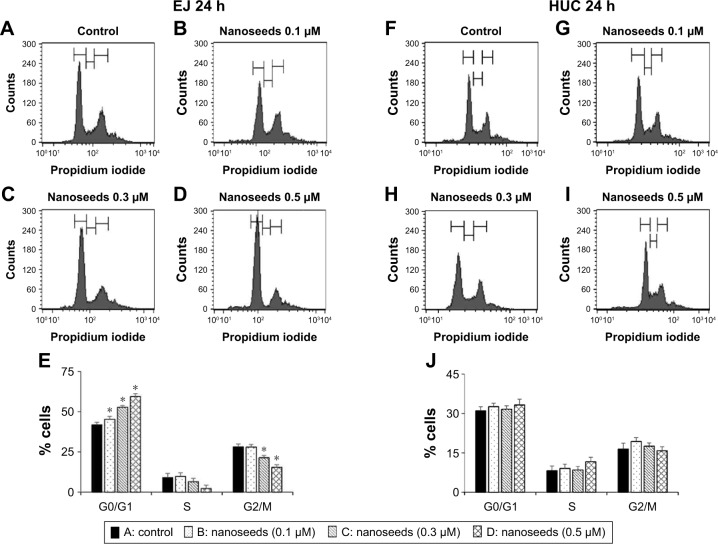
Figure 2.
Cell cycle phase distribution of EJ cells treated with Au@Pt-NSs.
Notes: Both EJ cells and HUCs were incubated with Au@Pt-NSs at concentrations of 0 μM (A, F), 0.1 μM (B, G), 0.3 μM (C, H), and 0.5 μM (D, I) for 24 h. FACS histograms of EJ cells (A–E) and HUCs (F–J) are shown. Values on the bar graph are presented as mean ± SD from triplicate experiments. *P < 0.05, compared with the control group.
Abbreviations: Au@Pt-NSs, gold@platinum nanoseeds; FACS, fluorescence-activated cell sorting; HUCs, human urothelial cells.

