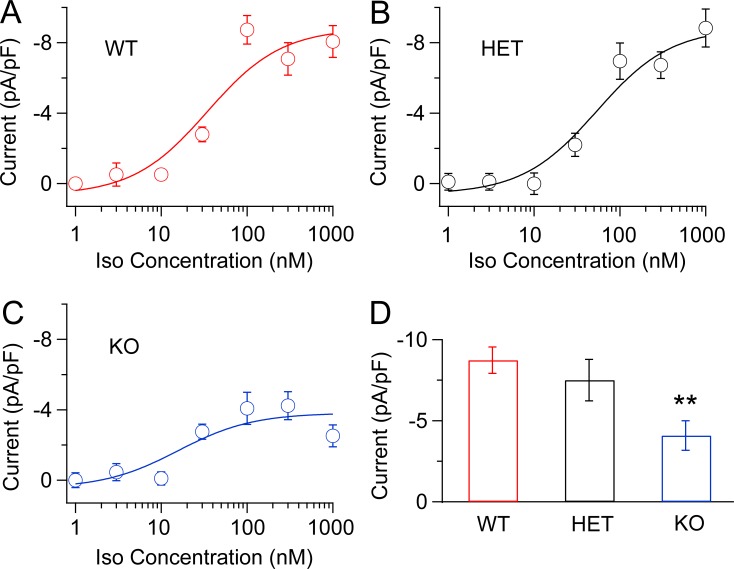
Figure 4.
Concentration–response curves for Iso-induced Ca2+ currents in myocytes from WT, LCyphHET, and LCyphKO mice. Representative Ca2+ currents evoked by depolarization from −40 to 0 mV after treatment of dissociated cardiac myocytes with the indicated concentrations of Iso. (A) WT mice. (B) LCyphHET (HET) mice. (C) LCyphKO (KO) mice. (D) Mean maximal β-adrenergic–stimulated Ca2+ currents (calculated as Iso current/basal current and normalized for reduced expression of CaV1.2 in LCyphKO mice) at a test potential of 0 mV from WT, LCyphHET, and LCyphKO mice. Concentration–response curves were fit by a Hill equation with nH = 1. The resulting estimates of concentrations that give a half-maximal response for stimulation by Iso were 34.4 nM in WT, 53.5 nM in LCyphHET, and 25.7 nM in LCyphKO mice. n = 4–8 cells for each data point; n = 8–10 mice of each genotype. WT, −8.73 ± 0.81 pA/pF; LCyphHET, −7.5 ± 1.3 pA/pF; LCyphKO, −4.9 ± 1.1 pA/pF; P < 0.05. **, P < 0.01. Error bars indicate SEM.

