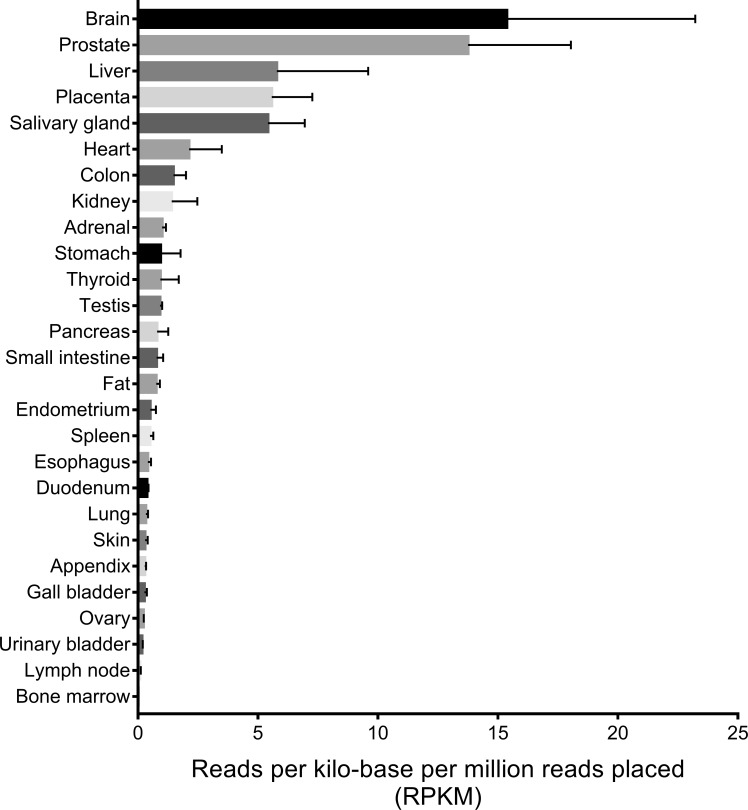
Figure 1.
Syt-7 RNA-seq results from 27 human tissues. Quantitative transcriptomic analysis (RNA-seq) of Syt-7 was performed using NCBI (https://www.ncbi.nlm.nih.gov/gene/9066/?report=expression) with data obtained from Fagerberg et al. (2014), BioProject PRJEB4337, and BioProject PRJEB4337. The relative expression levels are shown in reads per kilobase per million reads placed (RPKM). RPKM is a normalized unit of specific gene transcription. Genes in different tissues were screened and scored based on total RNA level. The scores are normalized to 1 million reads (per million reads placed) to correct for the transcription activity differences in various tissues. The “per million reads placed” scores are divided by the length of the gene (per kilobase). Error bars represent SD.

