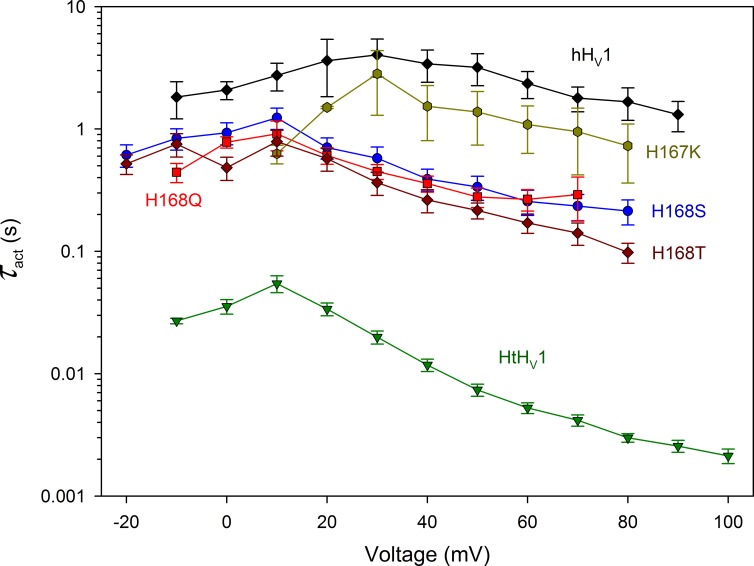
Figure 3.
The throttle histidine explains only a fraction of the rapid activation of HtHV1. Activation time constants (τact) were determined by single exponential fits to currents in WT HtHV1, WT hHV1, and in four hHV1 mutants, as indicated, all at pHo 7 and pHi 7. Mean ± SEM is plotted for 3–12 WT hHV1, 2–3 H167K, 3–6 H168S, 3–9 H168Q, 3–6 H168T, and 7–17 WT HtHV1. At all voltages from −10 to +80 mV, the WT hHV1 value is significantly larger than that of H168T, H168S, and H168Q combined and larger than HtHV1 (P < 0.01). The WT hHV1 data were taken from Cherny et al. (2015) and the HtHV1 data from Thomas et al. (2018).

