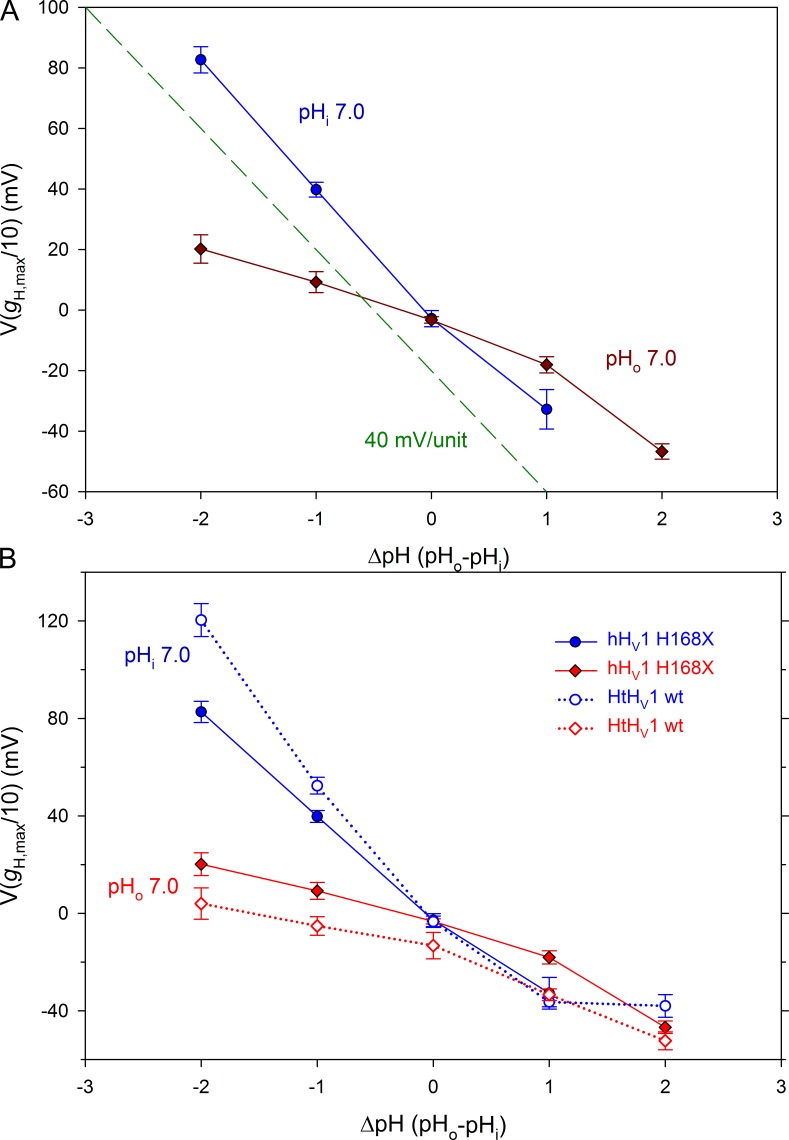
Figure 6.
The His168 mutation recapitulates the anomalous ΔpH dependence of HtHV1. (A) The effect of pHo and pHi on the position of the gH-V relationship in the three H168x mutants combined (mean ± SEM) is plotted. The position of the gH-V relationship was defined in terms of V(gH,max/10). The dashed green line shows a slope of 40 mV/unit for reference. The dependence of these mutants on pHo is normal, whereas their pHi response is greatly attenuated. Linear regression on all points (ignoring the obvious nonlinearity) gives a slope of 38.9 mV/unit change in pHo and 16.1 mV/unit change in pHi. (B) The same data are replotted (shaded symbols) along with the analogous measurements for HtHV1 (open symbols) taken from Fig. 9 of the companion article (Thomas et al., 2018). In whole-cell measurements, pHo was varied with pHi 7 (blue symbols). When pHi was varied by using inside-out patches with pHo 7, there was very little shift of the gH-V relationship (red symbols). Numbers of cells for increasing ΔpH in H168X mutants for pHi 7 are 3, 10, 11, and 5 and for pHo 7 are 6, 10, 14, 11, and 4.

