Figure 2.
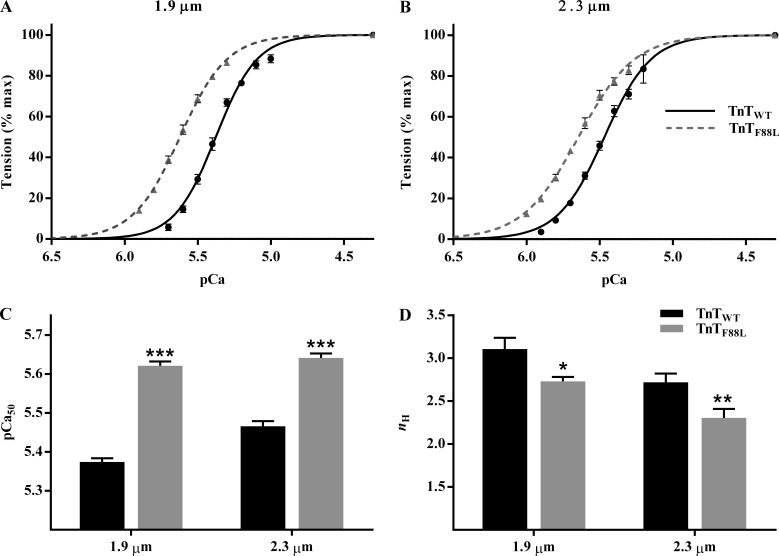
Effect of TnTF88L on pCa–tension relationship at short and long SLs. (A and B) A comparison of pCa–tension relationship between TnTWT and TnTF88L muscle fibers at short SL (A) and long SL (B). Steady-state tensions at various pCa values were normalized to the corresponding value at pCa 4.3 and plotted against pCa to derive pCa–tension data. Normalized pCa–tension data measured from several muscle fibers per group were averaged and presented as mean ± SEM. Error bars are smaller than symbols in some cases. (C and D) Bar graphs showing the effect of TnTF88L on myofilament Ca2+ sensitivity (C; pCa50) and cooperativity (D; nH) at short and long SLs. Normalized pCa–tension data from each muscle fiber was individually fitted to Hill’s model to derive pCa50 and nH. Estimates from several fibers per group were averaged and presented as mean ± SEM. Two-way ANOVA revealed a significant TnT–SL interaction effect (P = 0.003) on pCa50. Two-way ANOVA did not show a significant TnT–SL interaction effect on nH (P = 0.84); however, the main effect of TnT was significant (P < 0.001). Post hoc multiple pairwise comparisons (Fisher’s LSD) were used to determine significant differences between groups. Asterisks indicate significant difference from TnTWT at a given SL (*, P < 0.05; **, P < 0.01; ***, P < 0.001). The numbers of fibers measured (from three hearts) for TnTWT and TnTF88L at short SL were 10 and 10, and those at long SL were 9 and 10, respectively.

