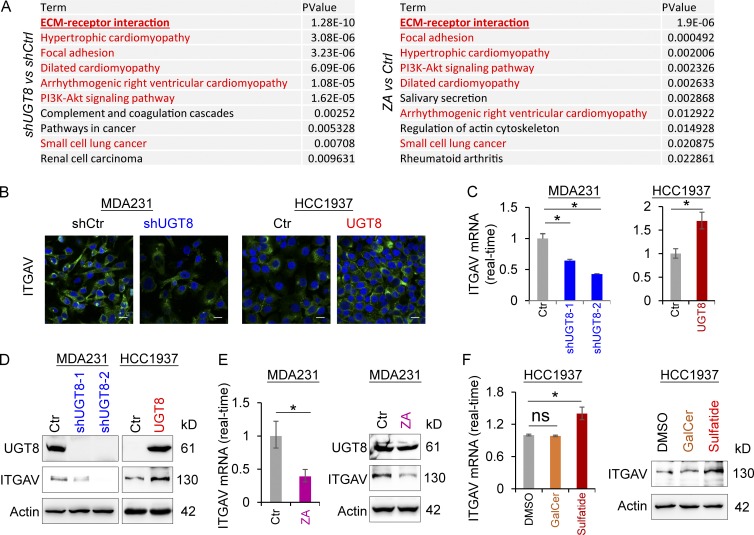
Figure 5.
UGT8 knockdown and ZA treatment have similar gene expression profiles and UGT8-mediated sulfatide induces ITGAV expression. (A) KEGG pathway analysis of down-regulated genes after UGT8 knockdown (fold change less than −2; left panel) and ZA treatment (30 µM; fold change less than −1.5; right panel) in MDA-MB231 cells. The top 10 most significant KEGG pathway terms were listed. (B) Expression of ITGAV was measured by immunofluorescent staining in MDA-MB231 cells with stable empty vector or knockdown of UGT8 expression as well as HCC1937 cells with stable empty vector or UGT8 expression. Nuclei were visualized with DAPI (blue). Bars, 20 µm. (C) Expression of ITGAV mRNA was analyzed by quantitative RT-PCR in MDA-MB231 cells with stable empty vector or knockdown of UGT8 expression as well as HCC1937 cells with stable empty vector or UGT8 expression. (D) Expression of ITGAV was analyzed by Western blotting in MDA-MB231 cells with stable empty vector or knockdown of UGT8 expression as well as HCC1937 cells with stable empty vector or UGT8 expression. (E) Expression of ITGAV was analyzed by quantitative RT-PCR (left) or Western blotting (right) in MDA-MB231 cells treated with or without ZA (10 µM). (F) Expression of ITGAV was analyzed by quantitative RT-PCR (left) or by Western blotting (right) in HCC1937 cells treated with or without GalCer (2 µM) or sulfatide (2 µM). Data are shown as mean ± SD based on three independent experiments. *, P < 0.01 by Student’s t test.

