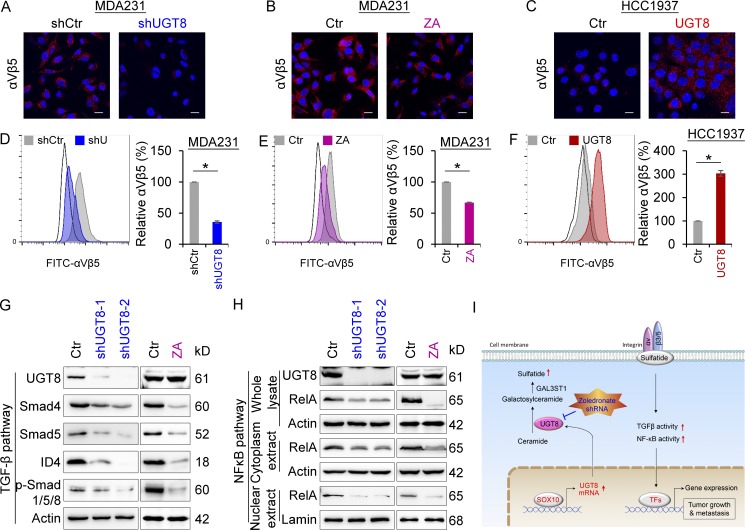
Figure 6.
UGT8 activates αVβ5 signaling. (A–C) Expression of αVβ5 was measured by immunofluorescent staining in MDA-MB231 cells with stable empty vector or knockdown of UGT8 expression (A), MDA-MB231 cells treated with or without ZA (20 µM; B) as well as HCC1937 cells with stable empty vector or UGT8 expression (C). Nuclei were visualized with DAPI (blue). Bars, 20 µm. (D–F) The level of αVβ5 was analyzed by flow cytometry in MDA-MB231 cells with stable empty vector or knockdown of UGT8 expression (D), MDA-MB231 cells treated with or without ZA (10 µM; E) as well as HCC1937 cells with stable empty vector or UGT8 expression (F). Representative images were shown (left). Isotype controls are used to determine the staining specificity (unfilled). The level of αVβ5 in cells with knockdown of UGT8 expression or UGT8 expression as well as cells treated with ZA was shown as a percentage of the control (mean ± SD in three separate experiments). *, P < 0.01 by Student’s t test. (G) Expression of UGT8, Smad4, Smad5, p-Smad1/5/8, and ID4 was analyzed by Western blotting in MDA-MB231 cells with stable empty vector or knockdown of UGT8 expression (left), as well as MDA-MB231 cells treated with or without ZA (10 µM; right). (H) Expression of UGT8 and RelA was analyzed by Western blotting in MDA-MB231 cells with stable empty vector or knockdown of UGT8 expression (left) as well as MDA-MB231 cells treated with or without ZA (10 µM; right). (I) A proposed model to illustrate the transcription activation of UGT8 by Sox10, which activates sulfatide–αVβ5 signaling axis in BLBC (see Discussion). TFs, transcription factors.

