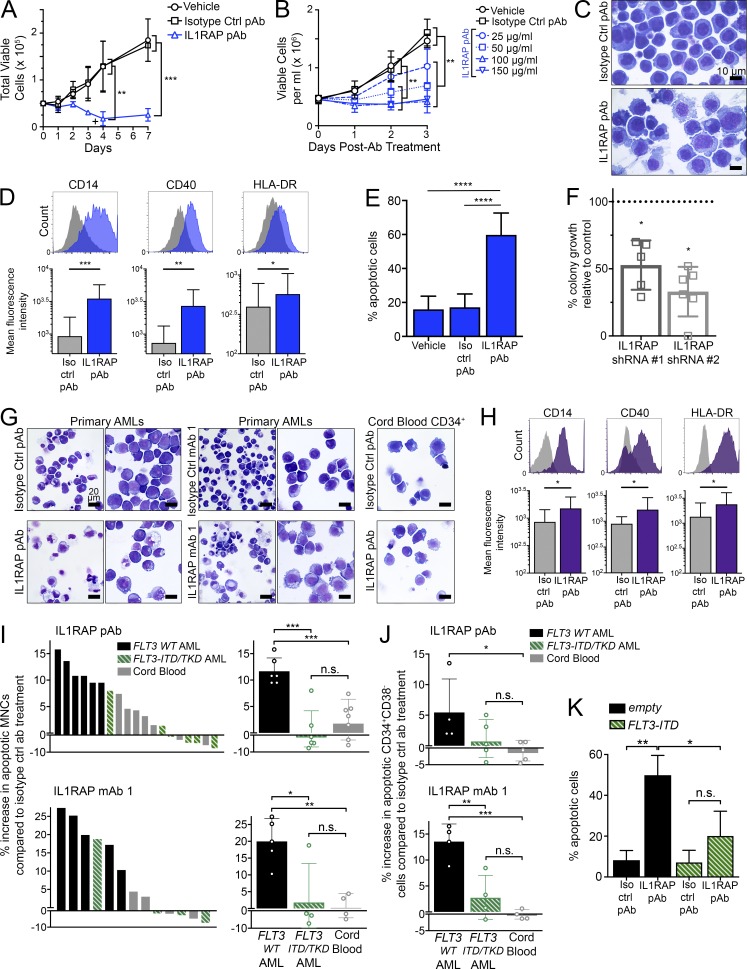
Figure 1.
Targeting of IL1RAP reduces growth of human AML cells by inducing differentiation and apoptosis, without affecting healthy hematopoietic cells. (A) Cell proliferation of THP-1 AML cells with replenishment of IL1RAP polyclonal antibody (pAb). 100 µg/ml of each antibody was added at day 0 and where indicated by the symbol +. Data represent the mean ± SD of two independent experiments. P-values were calculated using unpaired two-tailed t tests, and multiple comparisons were corrected for using the Holm-Sidak method. (B) Cell proliferation of THP-1 cells treated with different doses of IL1RAP pAb. Data represent the mean ± SD of three independent experiments. P-values were calculated using unpaired two-tailed t tests and multiple comparisons were corrected for using the Holm-Sidak method. (C) Morphology of THP-1 cells after treatment with 150 µg/ml IL1RAP pAb or isotype control pAb for 24 h.(D) Expression of macrophage differentiation markers in THP-1 cells by flow cytometry 24 h after addition of 150 µg/ml IL1RAP pAb. Representative histograms are shown (top). Bar graphs (bottom) represent the mean ± SD of five independent experiments. P-values were calculated using ratio paired two-tailed t tests comparing raw MFI values of isotype control pAb– versus IL1RAP pAb–treated cells. (E) Percentage of apoptotic (annexinV+) THP-1 cells after treatment with 150 µg/ml IL1RAP pAb for 72 h. Data represent the mean ± SD of five independent experiments. P-values were calculated using unpaired two-tailed t tests. (F) Colony formation of primary AML MNCs in semisolid media after knockdown of IL1RAP by two shRNAs. Fold change relative to a control shRNA (dotted line) is shown. Each point represents an individual patient: MDS01, MDS02, AML03, AML07, AML13, and AML15 (#2 only). Mean ± SD is shown. P-values were calculated using ratio paired two-tailed t tests comparing raw colony numbers of control shRNA– versus IL1RAP shRNA–treated cells. (G) Morphology of primary AML MNCs or cord blood CD34+ cells after treatment with 300 µg/ml IL1RAP antibodies for 48 h. AML samples shown are AML05 (left) and AML17 (right) for each antibody. 50×, 0.95 NA. (H) Expression macrophage differentiation markers in primary AML samples by flow cytometry 24 h after addition of 300 µg/ml IL1RAP pAb. Histograms from sample AML18 are shown (top). Bar graphs (bottom) represent the mean ± SD of six different primary AML patient samples (AML01, AML05, AML07, AML16, AML18, and AML019). P-values were calculated using Wilcoxon test comparing raw MFI values of isotype control pAb– versus IL1RAP pAb–treated cells. (I) Increase in apoptotic (annexinV+) primary AML or primary cord blood MNCs after treatment with 300 µg/ml IL1RAP pAb (top graphs) or IL1RAP mAb 1 (bottom graphs) for 48 h. Percent increase in apoptosis relative to isotype control pAb treatment is represented two different ways. Left, each bar represents an individual patient. Solid black bars indicate AML patients without FLT3 mutations, striped green bars indicate AML patients harboring FLT3 activating mutations (ITD or TKD), and gray bars represent healthy cord blood samples. Right, patient samples are grouped by type: FLT3 WT AML, FLT3-ITD or -TKD AML, or cord blood. Each point (open circles) represents an individual patient. Mean ± SD is shown. P-values were calculated using unpaired two-tailed t tests. (J) Increase in apoptotic (annexinV+) primary AML or primary cord blood CD34+CD38− cells after treatment with 300 µg/ml IL1RAP pAb (top graph) or IL1RAP mAb 1 (bottom graph) for 48 h. Patient samples are grouped by type: FLT3 WT AML, FLT3-ITD or -TKD AML, or cord blood. Each point (open circles) represents an individual patient. Mean ± SD is shown. P-values were calculated using unpaired two-tailed t tests. (K) Percentage of apoptotic (annexinV+) THP-1 cells transduced with MSCV-GFP empty control or MSCV-FLT3-ITD-GFP and treated with 150 µg/ml IL1RAP pAb for 72 h. Data represent the mean ± SD of three independent experiments. P-values were calculated using unpaired two-tailed t tests. *, P < 0.05; **, P < 0.01; ***, P < 0.001; ****, P < 0.0001.

