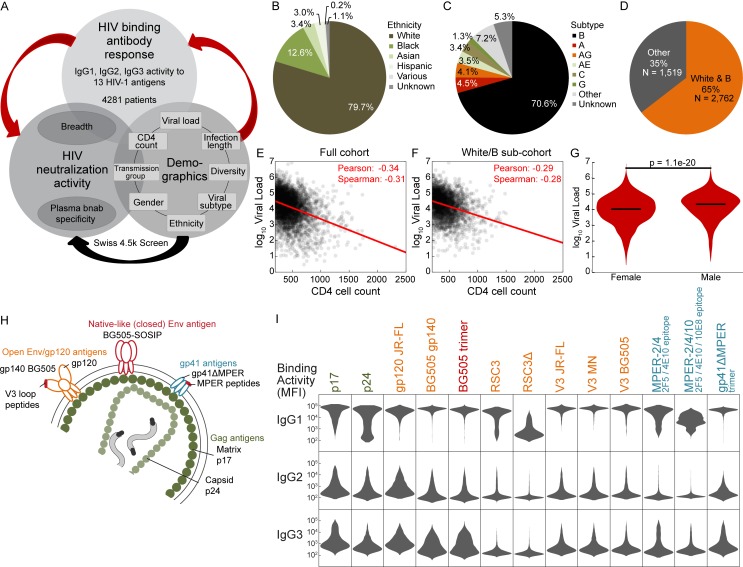
Figure 1.
Systematic survey of IgG subclass responses to HIV-1 Env and Gag antigens. (A) Experimental study design. Red arrows indicate aspects examined in the current study. (B and C) Distribution of ethnicities (B) and HIV-1 subtypes (C) in the cohort. (D) Relative size of the white/B subcohort. (E and F) Scatterplot of log10 viral load and CD4 cell count for the full cohort (E) and the white/B subcohort (F). A red linear regression line and the Spearman and Pearson correlation coefficients are shown. (G) Distribution of log10 viral load in females and males in the full cohort (pMann-Whitney = 1.1e-20). (H) Overview of 13 HIV-1 antigens selected for IgG response monitoring. (I) Summary of measured IgG-binding antibody response (MFI raw data; Luminex binding assay; single measurements) in 4,281 chronic HIV-1–infected individuals. Relative binding activities (Table S1) derived from these MFI raw data were used for further analysis.

