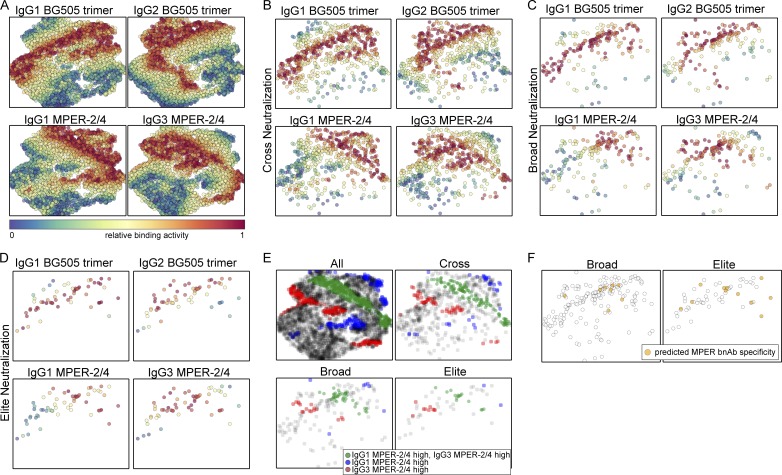
Figure 10.
Two-dimensional representation of all plasma samples based on binding antibody responses. Two-dimensional t-SNE map (Barnes-Hut-SNE approximation with 1,000 iterations) of all plasma samples (n = 4,281) based on the relative binding activities to BG505 trimer (IgG1 and IgG2) and MPER-2/4 (IgG1 and IgG3). (A) Points in each subplot are colored by the strength of response to one of the four relative binding activities (red color denotes high binding activity, and blue denotes low binding activity). (B–D) The t-SNE map from A is stratified by neutralization capacity, cross (n = 684; C), broad (n = 178; D), and elite (n = 58; E) neutralization. (E) The t-SNE map from A is stratified by neutralization capacity of plasma (all, cross, broad, or elite neutralization). Plasma with high relative binding (>0.667) for either IgG1 (blue) or IgG3 (red) MPER-2/4 or both (green) is colored. (F) The t-SNE map from A is stratified by neutralization capacity of plasma (broad or elite neutralization). Plasma with predicted MPER specificity (n = 19) is colored.

