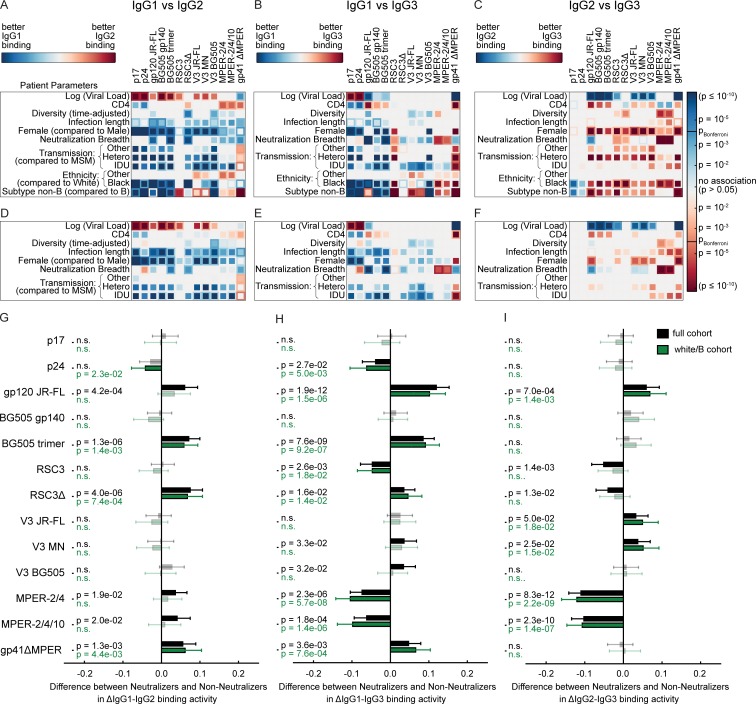
Figure 4.
Comparison of relative binding activities between IgG subclasses. (A–I) Analysis of the full cohort (n = 3,159; A–C and G–I) and the white/B subcohort (n = 2,122; D–I) with complete data on the included host, viral, and disease parameters. The influence of the virus load, CD4 count, viral diversity, length of untreated HIV-1 infection, transmission route, gender, neutralization breadth (at least cross neutralization), ethnicity, and HIV-1 subtype on the differences in binding antibody responses to each tested HIV-1 antigen was determined by univariable (inner squares) and multivariable (outer squares) linear regression for all three pairs of IgG subclasses. Only significant associations (P < 0.05) are colored, and the Bonferroni-corrected significance threshold (P = 0.00012) is shown in the color map. The color intensity represents the significance level. (G–I) Difference in neutralizers and nonneutralizers in differential IgG subclass (ΔIgG) binding activity, based on the same multivariable linear regression analysis as in A–F. Error bars depict the 95% confidence intervals. Nonsignificant associations are marked by n.s. and are shown in lighter color shades.

