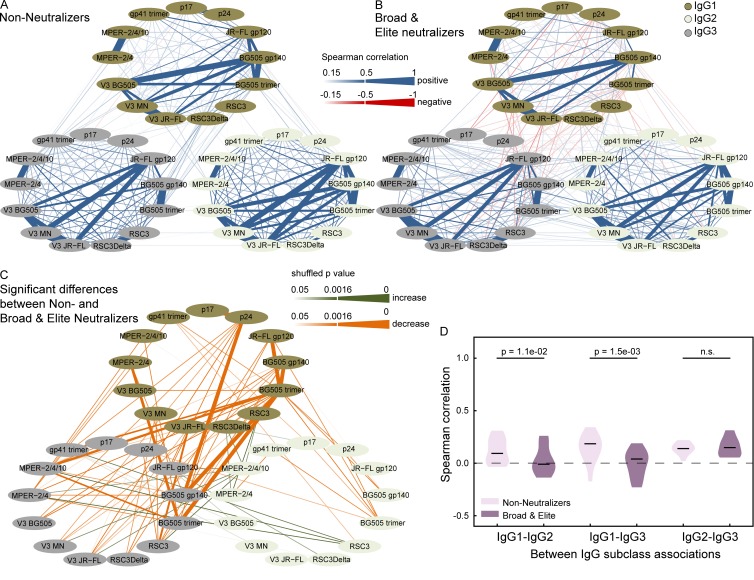
Figure 6.
Differential landscape of HIV-1 IgG responses in broad neutralizers. (A and B) Pairwise Spearman correlation analysis of the relative binding activities to the 13 HIV-1 antigens within and between subclass IgG1 (dark green), IgG2 (light green), and IgG3 (gray) in white subtype B–infected patients with late chronic (3- to 10-yr untreated) infection. Correlations with a magnitude >0.15 are depicted in blue (positive associations) and red (negative associations). The strength of Spearman correlation is signified by color intensity for correlations with magnitudes from 0.15 to 0.5 and additionally by line width for magnitudes >0.5. (A) Patients with no or low neutralizing activity (n = 1,673). (B) Patients with broad or elite neutralizing activity (n = 143). (C) Significant differences (pshuffle < 0.05; 10,000 random reshuffles) in pairwise Spearman correlations between broad neutralizers (as in B) and nonneutralizers (as in A) are shown. Green and orange shaded lines denote correlations that increase or decrease among broad neutralizers, respectively. The significance level of differences is depicted by color intensity and additionally by line width for differences that remain significant after correction for multiple testing (Benjamini-Hochberg correction with a false discovery rate of 10%; pshuffle ≤ 0.0016). (D) The distribution of all pairwise between IgG subclass correlations of individual antigens (Fig. 5 E) is shown for the nonneutralizers (light violet) and potent (broad or elite) neutralizers (dark violet). Significant p-values from a paired Wilcoxon test are shown.

