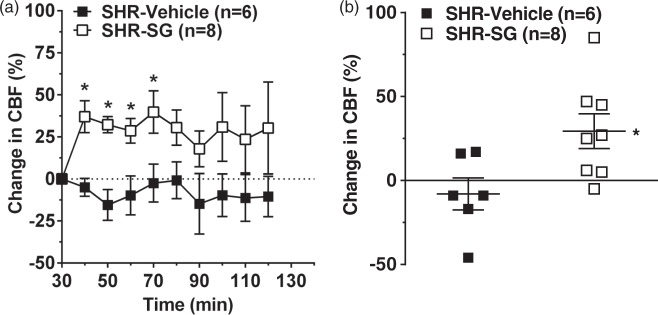
Figure 2.
Effect of SG treatment on collateral CBF during ischemia. (a) Graph showing percent change in collateral CBF (probe 2) calculated as a percent change from prior to treatment and 30 min after filament occlusion. Vehicle-treated SHR had minimal changes in collateral flow during the entire ischemic duration. However, treatment with SG significantly increased collateral flow during the first 40 min after treatment and remained elevated throughout ischemia. (b) Graph showing the average change in collateral flow for 90 min in response to SG or vehicle. Vehicle-treated SHR had collateral flow that was below baseline versus prior to treatment whereas SG treatment significantly increased collateral flow. *p < 0.05 vs. SHR vehicle-treated.

