Figure 4.
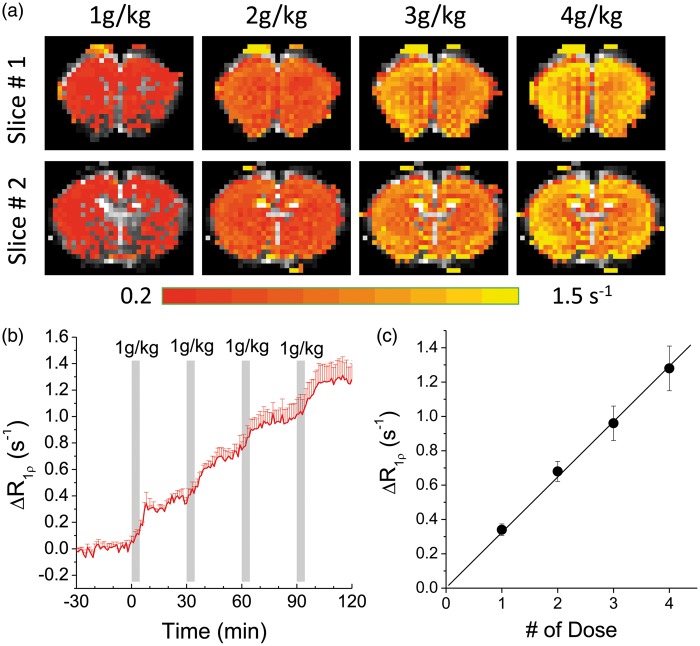
In vivo dose-dependent 3OMG-CESL. Comparison of the R1ρ change maps (a) and the time course (b) of R1ρ change with four consecutive intravenous (IV) injections of 1 g/kg 3OMG every 30 min. The injection periods are indicated by the gray bars. (c) The increase of R1ρ calculated from middle cortical ROIs shows a linear dependence on the injection dose. The best fitted slope is 0.32 s−1 per 1 g/kg injection. Error bars indicate standard deviations (n = 5).

