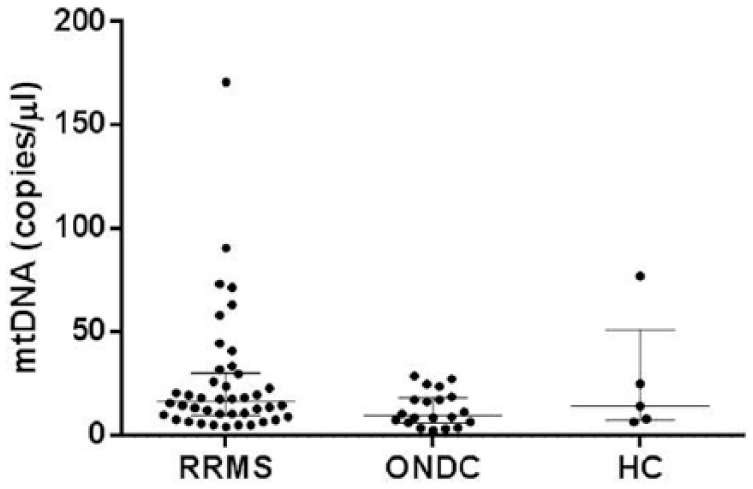
Figure 3.

Comparison of mtDNA levels between the subtypes (Swedish cohort). Scatter plot representing mtDNA concentrations for each individual grouped by diagnosis.
The horizontal lines correspond to median and interquartile range. RRMS: median 16.8 (IQR, 9.9–30.5) copies/µL; ONDC: median 9.8 (IQR, 6.4–18.6) copies/µL; HC: median 14.3 (IQR, 7.5–51.3) copies/µL; HC: healthy controls; ONDC: other neurological disease controls; RRMS: relapsing-remitting multiple sclerosis.
