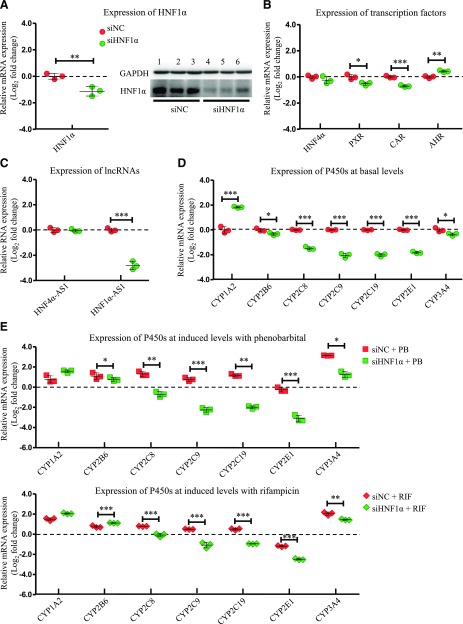
Fig. 3.
Changes of gene expression by HNF1α knockdown. (A) Suppression of HNF1α expression in both mRNA (left) and protein (right) levels by siRNA transfection into HepaRG cells. (B) Expression of the selected transcription factors after HNF1α knockdown. (C) Expression of HNF4α-AS1 or HNF1α-AS1 after HNF1α knockdown. (D) Expression of the selected P450s at basal levels after HNF1α knockdown. (E) Expression of the selected P450s at induced levels with treatment of either PB or RIF after HNF1α knockdown. The sample size for each group was n = 3. Data are presented as log2 fold change and shown as mean ± S.D. *P < 0.05; **P < 0.01; ***P < 0.001 vs. control in two-tailed unpaired Student’s t tests.

