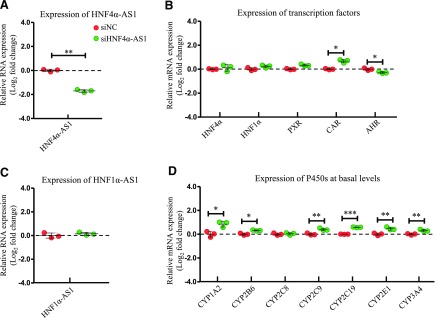
Fig. 6.
Changes of gene expression by HNF4α-AS1 knockdown. (A) Suppression of HNF4α-AS1 expression by siRNA transfection into HepaRG cells. (B) Expression of the selected transcription factors after HNF4α-AS1 knockdown. (C) Expression of HNF1α-AS1 after HNF4α-AS1 knockdown. (D) Expression of the selected P450s at basal levels after HNF4α-AS1 knockdown. The sample size for each group was n = 3. Data are presented as log2 fold change and shown as mean ± S.D. *P < 0.05; **P < 0.01; ***P < 0.001 vs. control in two-tailed unpaired Student’s t tests.

