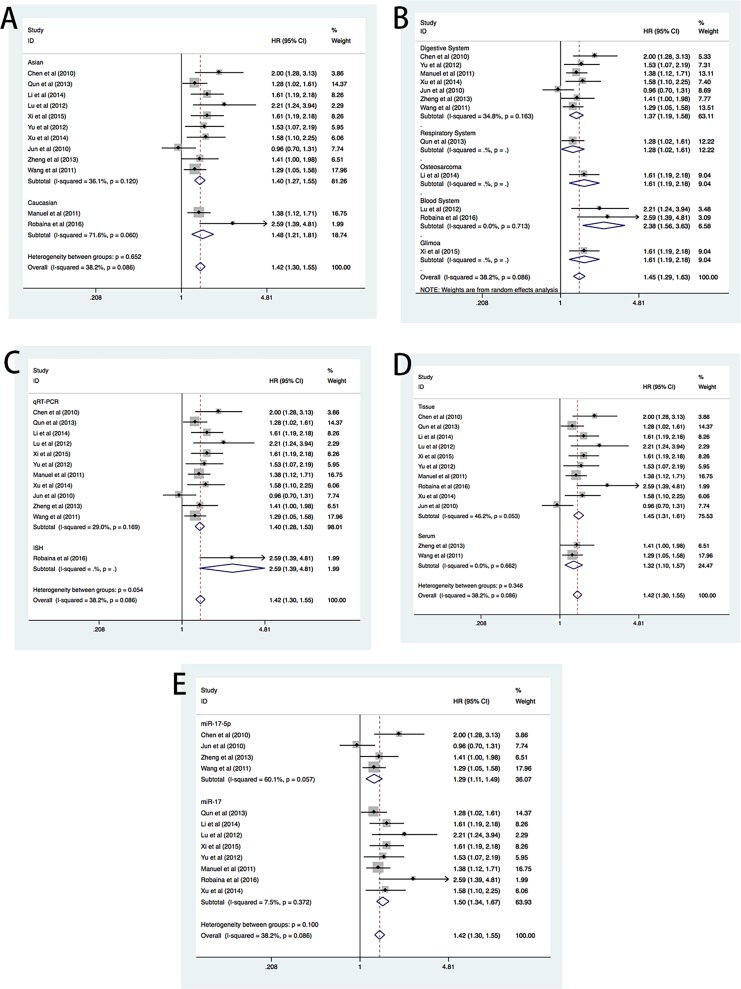
Figure 3.
Forest plots of subgroup meta-analysis of OS in association with miR-17 expression. (A) Forest plots of the merged analyses of OS in different ethnic groups. Squares and lines correspond to the study-specific HRs and 95% CIs, respectively. The area of the squares represents the weight, and the diamonds represent the summary of HRs and 95% CIs. (B) Forest plots of the merged analyses of OS in different diseases groups. (C) Forest plots of the merged analyses of OS in different RNA detection methods groups. (D) Forest plots of the merged analyses of OS in different sample groups. (E) Forest plots of the merged analyses of OS in the detection method of miR-17. ISH, in situ hybridisation; miR-17, microRNA-17; OS, overall survival; qRT-PCR, quantitative real-time PCR.

