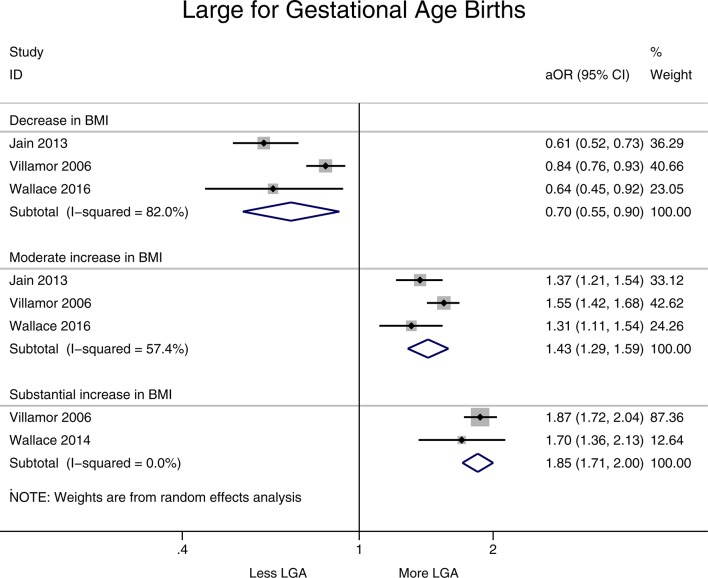
Figure 2.
Forest plot showing change in interpregnancy weight and the risk of large-for-gestational-age (LGA) births in all women relative to reference category (decrease in body mass index (BMI) defined as >−1 unit, moderate increase 1–3 units and substantial increase >3 units, reference category remained in same BMI category or changed by up to −2 to +2 units). aOR, adjusted OR.

