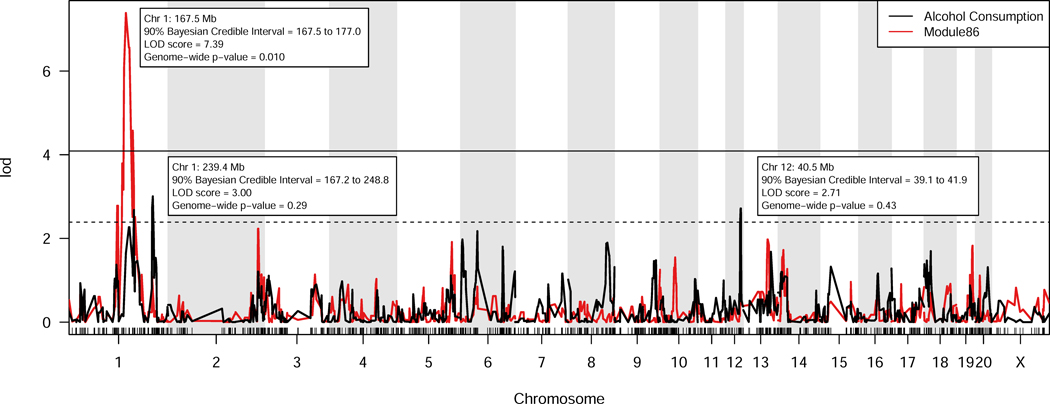
Figure 1. Alcohol consumption QTLs and liver module 86 eigengene QTL (meQTL).
Strain means and R/qtl were used to calculate both the QTLs for voluntary alcohol consumption (Saba et al. 2015), and meQTL for module 86. The horizontal lines represent genome-wide significant (p<0.05, solid line) and genome-wide suggestive (p<0.63) LOD scores (Lander and Kruglyak 1995). The location and significance of the module 86 meQTL (red) and the alcohol consumption QTLs (black) are shown.

