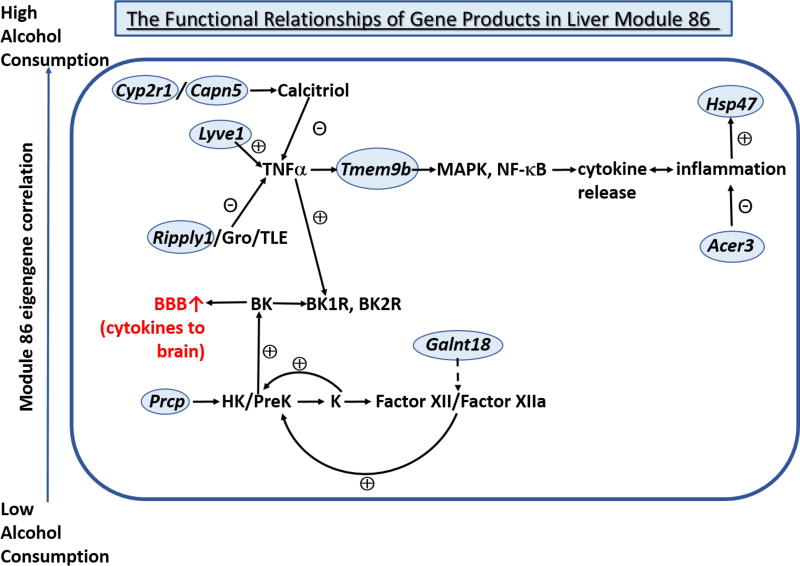
Figure 3. Functional relationships among transcripts in the liver transcriptional coexpression module associated with alcohol consumption (Module 86).
Each of the transcripts in the coexpression module is circled in blue. The ⨁ and ⊝ signs indicate the effects of the transcript products on the activity of the indicated pathway. The module eigengene is positively correlated with the phenotype of alcohol consumption across the HXB/BXH RI strains, as indicated by the arrow on the left. The correlations among the transcripts are indicated in Figure 2. ↑BBB = increase in permeability of the blood-brain barrier; PreK = prekallikrein; K = kallikrein; BK = bradykinin; BK1R and BK2R = bradykinin 1 and 2 receptors, respectively.

