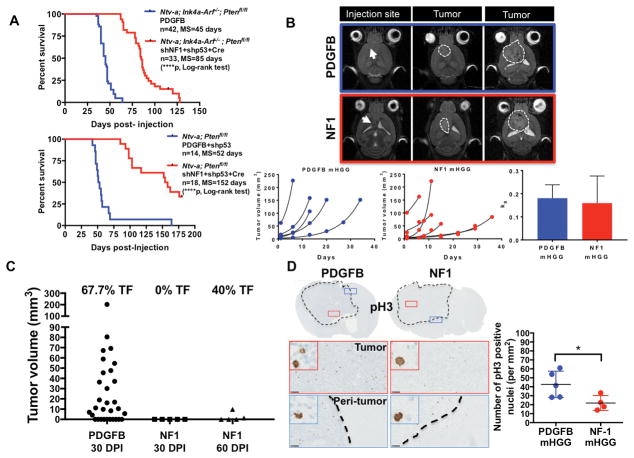
Fig. 1. PDGFB-overexpressing and NF1-silenced mHGG display significantly different median survivals and tumor initiation times, but similar tumor growth kinetics.
A) Kaplan-Meier survival curve showing overall survival of PDGFB-overexpressing and NF1-silenced mHGG in mixed strain Ntv-a/Ink4a-Arf−/−/Pten fl/fl mice and C57BL/6 background Ntv-a/Pten fl/fl mice. NF1-silenced mHGG was generated by SVZ RCAS injection, while PDGFB-overexpressing mHGG was generated by injections in the frontal striatum. P-values were calculated using a log-rank (Mantel-Cox) test. B) Representative MR images of PDGFB-overexpressing and NF1-silenced mHGG showing the injection site as well as small and large tumors. Tumor growth curves were fitted with an exponential regression. Comparison of the mean growth rate constant (kg) for each group indicated no significant differences in growth kinetics. The x-axis (days) indicates the number of days after initial MRI when the scan was taken. C) Tumor volumes as measured by T2-weighted MRI scans taken 30 days following RCAS injection for both PDGFB-overexpressing (N=31) and NF1-silenced (N=5) mHGG as well as 60 days following RCAS injection for the NF1-silenced (N=5) model. Percent tumor formation (TF) is indicated above each group. D) Representative images of immunohistochemistry for pH3 staining of PDGFB-overexpressing (N=5) and NF1-silenced (N=4) mHGG in Ntv-a/Ink4a-Arf−/−/Pten fl/fl mice. pH3 quantification shows a significantly increased number of cells in the M-phase of the cell cycle in PDGFB-driven tumors compared to NF1-silenced tumors. Analysis was performed with unpaired, two-tailed Student’s t-tests. Scale bars= 100 μm. *=P<0.05, ****=P<0.0001.

