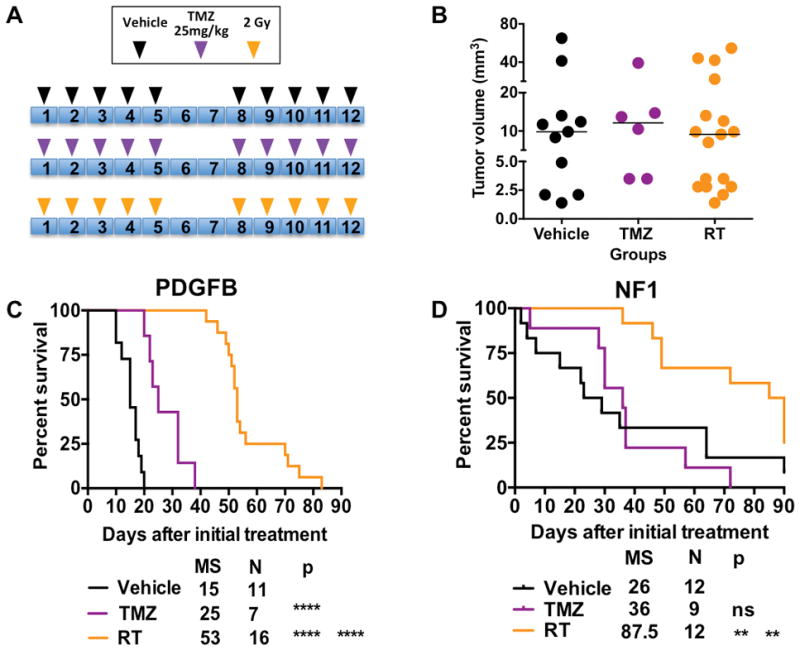
Fig. 7. RT treatment provides a survival advantage to mice with either PDGFB-overexpressing or NF1-silenced mHGG, while TMZ provides a survival advantage only to mice with PDGFB-overexpressing tumors.

A) Schematic illustrations of treatment paradigms and groups. B) Four weeks post-injection, mice with PDGFB-overexpressing mHGG were separated into treatment groups with matched sex, age, and average tumor size as measured by T2-weighted MRI. Similarly, mice with NF1-silenced mHGG were randomized into vehicle, TMZ, and RT treatment cohorts 8 weeks post-injection with age and sex equally distributed. C) Kaplan-Meier survival curves for the different treatment groups for PDGFB-overexpressing mHGG. D) Kaplan-Meier survival curves for the different treatment groups for NF1-silenced mHGG. Analysis was performed with a log-rank (Mantel-Cox) test. **=P<0.01, ****=P<0.0001.
