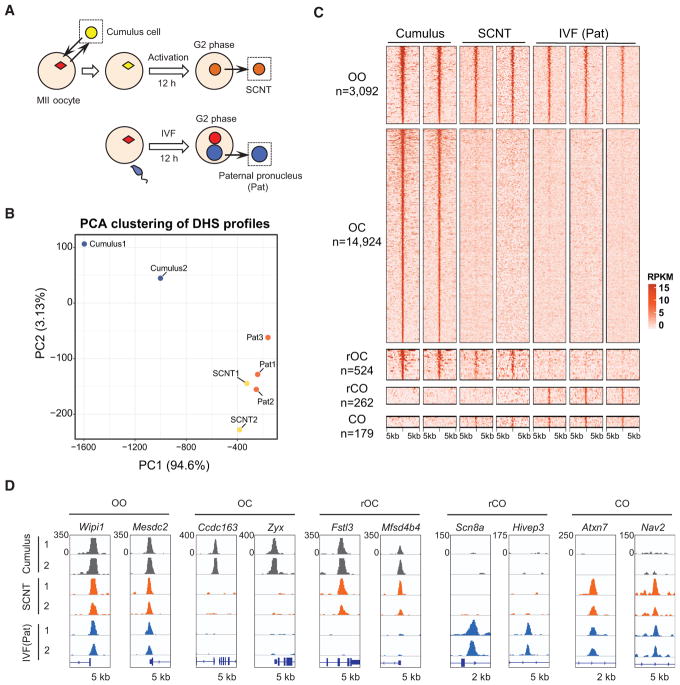
Figure 1. Rapid Reprogramming of Donor Cell Chromatin Accessibility in SCNT.
(A) Schematic illustration of the experimental design for studying the chromatin accessibility dynamics in SCNT and that of the paternal pronucleus from in vitro-fertilized (IVF) zygotes. The collected samples for liDNase-seq analysis are shown inside dotted boxes.
(B) PCA of the genome-wide DHS profile of the cumulus, IVF(Pat), and one-cell SCNT samples. Each dot represents one sample.
(C) Heatmap showing the DHSs clustered according to their combinatorial enrichment in cumulus, one-cell SCNT, and IVF(Pat) samples. Each row represents a locus (DHS center ± 5 kb), and the red gradient color indicates the liDNase-seq signal intensity. OO, open in cumulus cells, SCNT, and IVF(Pan); OC, open in cumulus cells and closed in SCNT and IVF(Pat); rOC, open in cumulus cells and closed in IVF(Pat), but failed to be closed in SCNT; rCO, closed in cumulus cells and open in IVF(Pat), but failed to be opened in SCNT; CO, closed in cumulus cells and open in IVF(Pat) and SCNT.
(D) Genome browser views showing the normalized coverage (per million mapped reads) at representative loci of the different DHS categories.
See also Figure S1.

