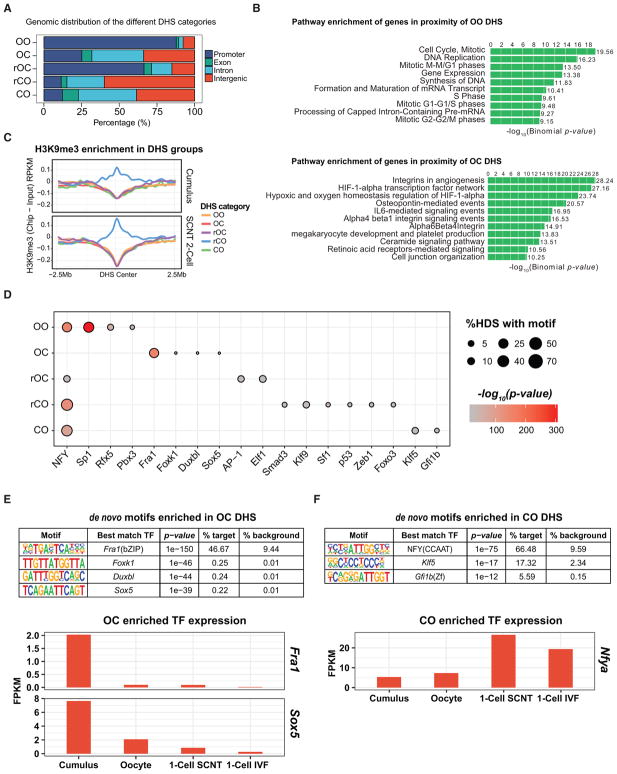
Figure 2. Transcription Factor Network Switch Likely Accompanies DHS Reprogramming.
(A) Bar graph showing the genomic distribution of the different DHS categories. DHS peaks within TSS ± 1 kb are considered promoter DHS, and those not located in promoters, exons, or introns are labeled as intergenic.
(B) Bar plot showing the top ten enriched pathways of OO- or OC-associated genes using GREAT enrichment (McLean et al., 2010).
(C) Averaged H3K9me3 ChIP-seq signal profile normalized to that of the input in cumulus and two-cell stage SCNT embryos in a DHS ± 2.5-Mb window.
(D) Dot plot showing the enriched de novo TFs motifs (x axis) in the different DHS categories (y axis). Circle size represents the proportion of DHS having the de novo TF motif, and the gradient red color indicates the p value enrichment. The names of TFs with motif enriched in the different DHS categories are indicated.
(E and F) TFs with binding motif enriched in the OC (E) and CO (F) DHSs and their relative expression levels in donor cells, oocytes, one-cell SCNT, and IVF embryos.
See also Figure S2.

