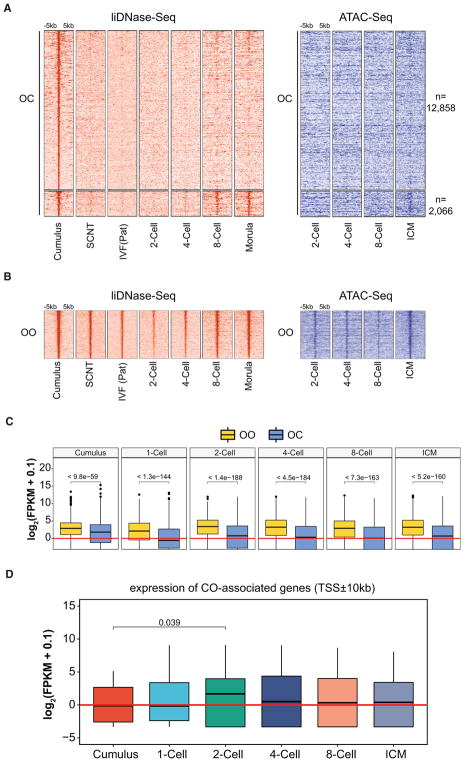
Figure 3. Loss of Donor Cell DHSs Is Associated with Downregulation of Somatic Cell Transcription Program.
(A and B) Heatmap showing the dynamics of OC (A) and OO (B) DHSs during preimplantation development analyzed by liDNase-seq (left) and ATAC-seq (right). Each row represents a locus (DHS center ± 5 kb), and the red and blue gradient colors represent the liDNase-seq and ATAC-seq signal intensity, respectively. OC DHSs were separated into two groups based on whether they reappear at the morula stage (FC[morula/cumulus] > 3, RPKM > 1, and mean RPKM > 2 in morula embryos). Peaks were ordered based on the signal intensity in cumulus cells.
(C) Averaged gene expression levels of the OO- or OC-associated genes (TSS ± 10 kb) in cumulus cells and preimplantation embryos. The p values were calculated using the Wilcoxon rank sum test.
(D) Averaged gene expression levels of the CO-associated genes (TSS ± 10 kb) in cumulus cells and preimplantation embryos. The p values were calculated using the paired t test.
See also Figure S3.

