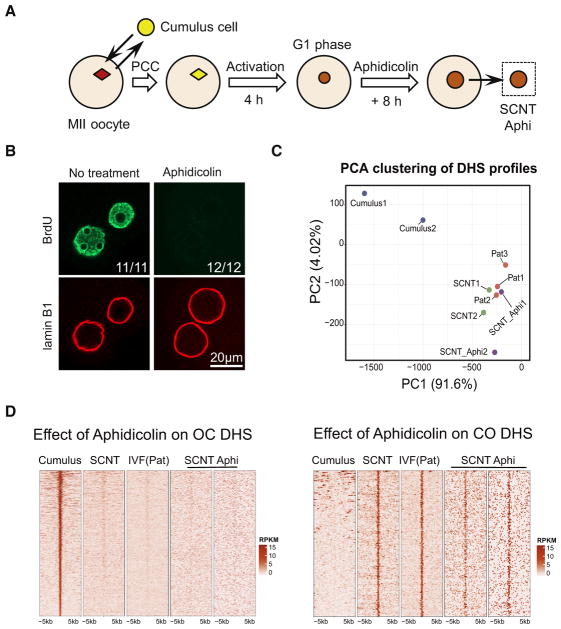
Figure 4. DHS Reprogramming in SCNT Is Independent of DNA Replication.
(A) Schematic illustration of the experiment to examine the effect of aphidicolin on SCNT-mediated DHS reprogramming.
(B) Representative images of SCNT one-cell embryos immunostained with BrdU and lamin B1 antibodies. No BrdU signal was detected in aphidicolin-treated embryos. The number of SCNT embryos exhibiting the staining pattern and the total number of embryos analyzed are shown, respectively. Scale bar: 20 μm.
(C) PCA of the genome-wide DHS profile of cumulus, IVF(Pat), SCNT, and aphidicolin-treated SCNT samples. Each dot represents an independent sample.
(D) Heatmap showing liDNase-seq enrichment signal in the OC and CO DHSs after aphidicolin treatment. Each row represents a locus (DHS center ± 5 kb), and the red gradient color indicates the signal intensity.
See also Figure S4.

