
Figure 4.
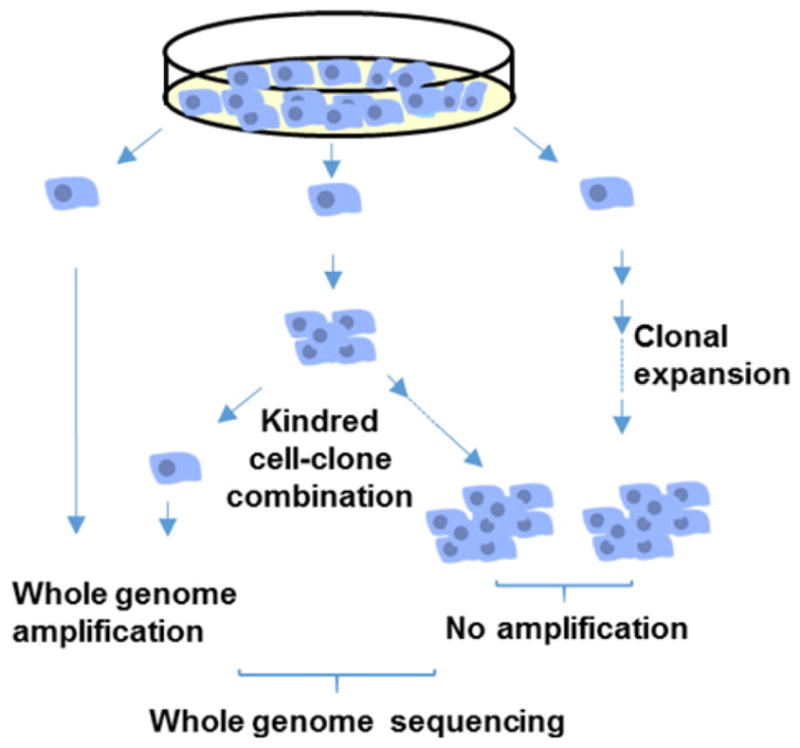
Schematic representation of whole genome sequence analysis of mutations in single human, primary fibroblasts after amplification and in unamplified clones from single fibroblasts taken from the same population.
Official websites use .gov
A
.gov website belongs to an official
government organization in the United States.
Secure .gov websites use HTTPS
A lock (
) or https:// means you've safely
connected to the .gov website. Share sensitive
information only on official, secure websites.
Schematic representation of whole genome sequence analysis of mutations in single human, primary fibroblasts after amplification and in unamplified clones from single fibroblasts taken from the same population.