
Figure 5. Frequency of somatic mutations in unamplified clones and amplified single cells.
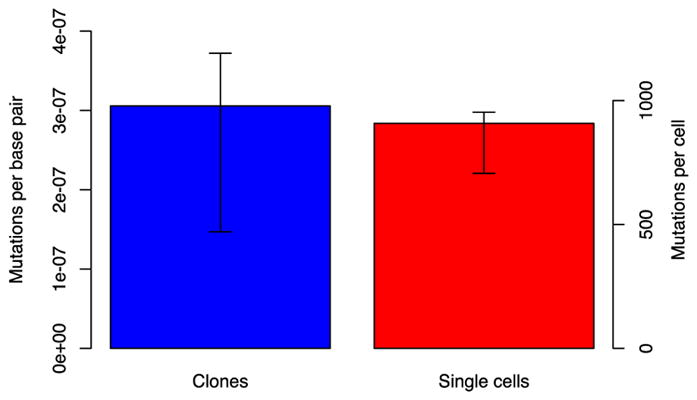
Clones and MDA amplicons derived from single human dermal fibroblasts were sequenced and the variants found compared with those in the bulk population to determine the somatic mutation frequency. There was no significant difference (P=0.76, Wilcoxon test) in the frequency of mutations observed, indicating that the single cell amplification protocol provides an accurate estimate of the somatic mutation frequency. The right-hand axis indicates the number of mutations per cell after adjustment for coverage. Error bars indicate 88% confidence intervals. From Milholland et al. [51].