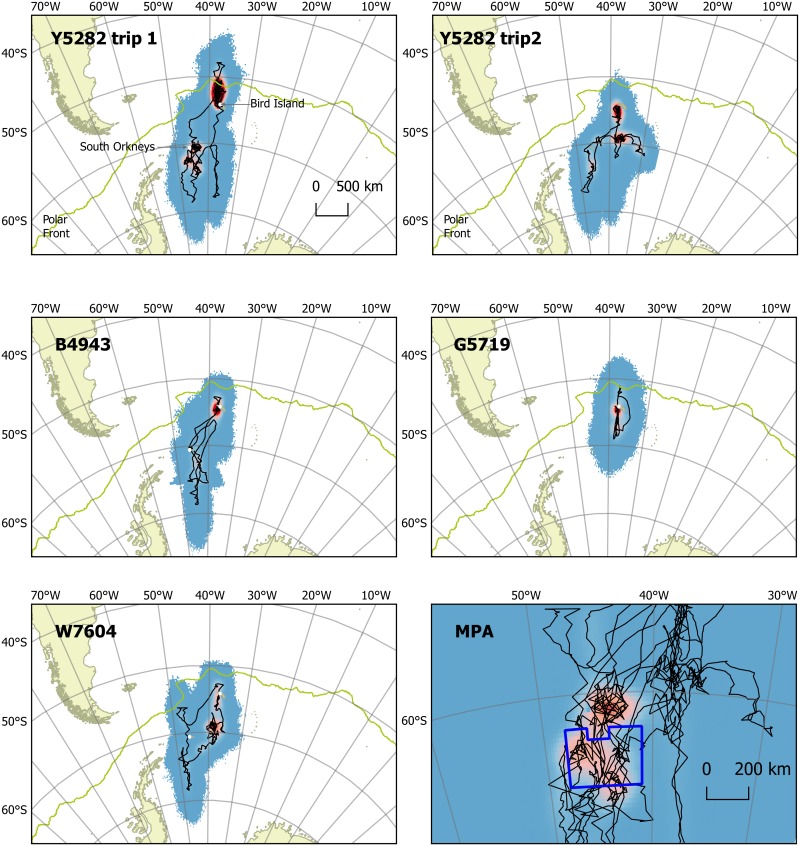
Fig 1. Density of time spent by individual leopard seals estimated by geolocation.
Each plot shows the gridded output of 1000 simulations of the intermediate location estimates weighted by time from low (blue) to high (red). Black lines show the mean estimated track. The pale green line indicates the approximate position of the polar front. MPA panel shows the outline of the South Orkney Islands’ marine protected area (thick dark blue line) with the combined time spent grid and mean estimated tracks from all seals.

