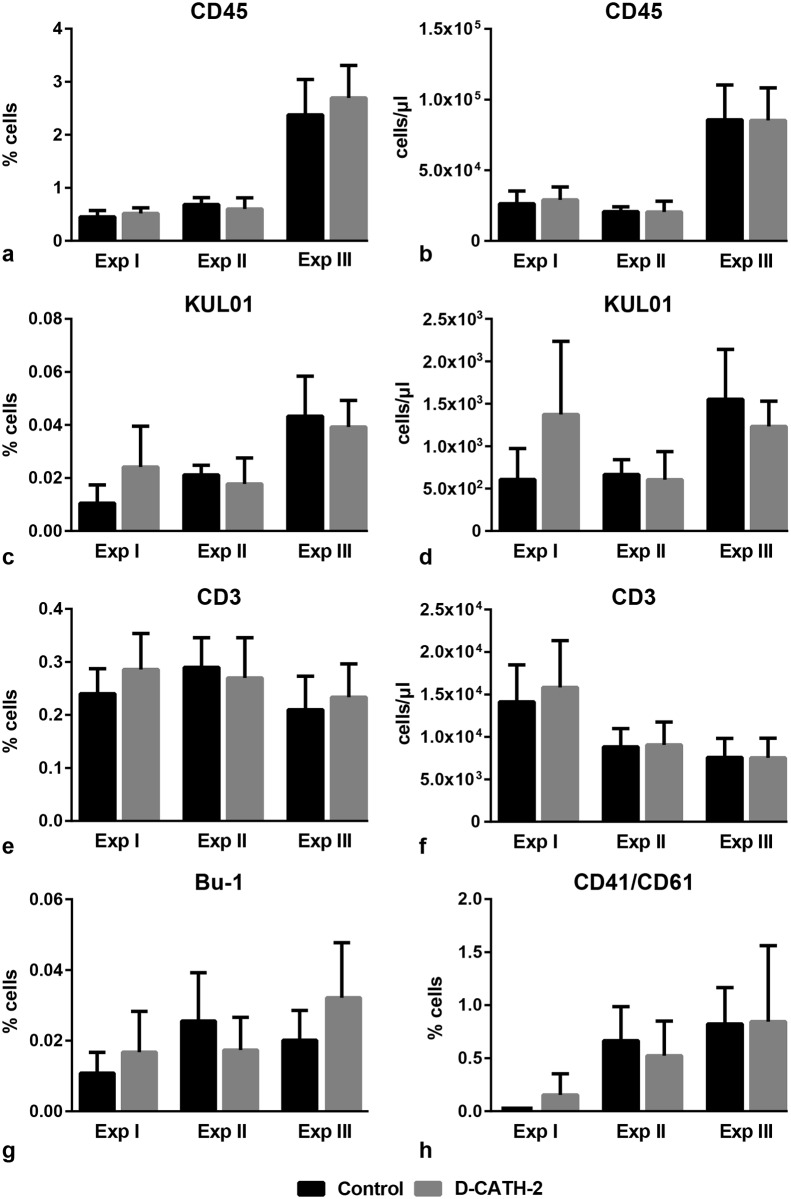
Fig 1. Leukocyte populations in peripheral blood.
Data from three repeated experiments. (a)-(b) total leukocytes (CD45), (c)-(d) mononuclear phagocytes (KUL01), (e)-(f) T-cells (CD3), (g) B-cells (Bu-1), (h) thrombocytes (CD41/CD6). Depicted are mean percentages of total cells (a,c,e,g,h) or mean absolute cell numbers (b,d,f) ± s.d., n = 6-8/group. Data of independent experiments were analyzed by an unpaired t-test, while combined data were analyzed using a General Linear Model.

