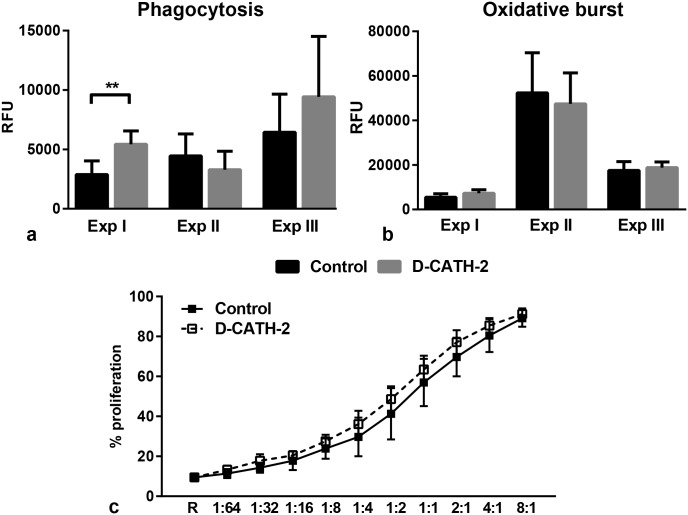
Fig 2. PBMC functions measured by ex vivo assays.
(a) Phagocytosis measured by uptake of pHrodo Green labelled E. coli. Increase in fluorescence from 1–6 hours of incubation. Data from three repeated experiments, (b) Oxidative burst measured by conversion of DCFH-DA to fluorescent DCF. Increase in fluorescence in 3 hours of incubation. Data from three repeated experiments, (c) Proliferation of responder PBMCs measured by MLR, Samples from Exp I, R = responder cells alone. Depicted are mean ± s.d., n = 5-8/group, ** = p<0.01. Data from independent experiments were analyzed by an unpaired t-test, combined phagocytosis and oxidative burst data were analyzed by a General Linear Model.

