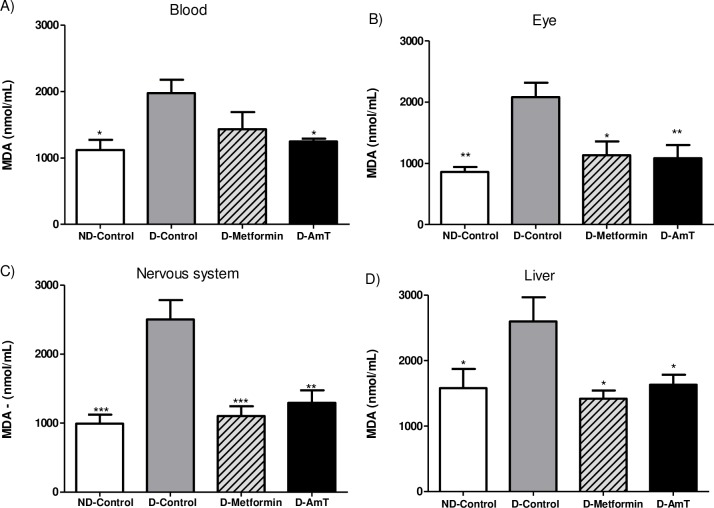
Fig 5. Malondialdehyde concentration (MDA) in the arterial blood, liver, nervous system, and eyes of normoglycemic and diabetic mice.
Groups include ND-Control (normoglycemic + water), D-Control (diabetic + water), D-Metformin (diabetic + metformin), and D-AmT (diabetic + AmT) after 21 days of treatment. Data are presented as the means ± SEM. * P<0.05; ** P<0.01; and ***P <0.001 versus D-Control group.

