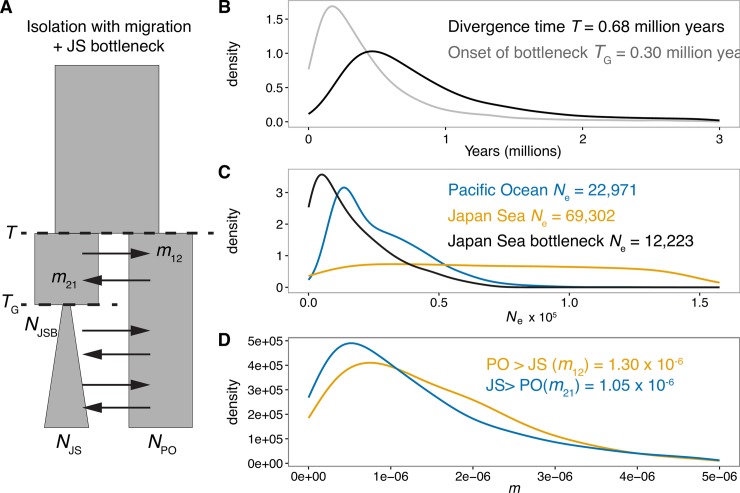
Fig 2. ABC analysis supports isolation with gene flow.
(A) A model of isolation with migration and a bottleneck in the Japan Sea lineage is best supported by ABC analysis using ~2,000 nuclear loci (see Table 1). Posterior probability densities for model parameters estimated using neural network analysis with a tolerance of 1% and 20 summary statistics. Parameters are: T = time of split, m12 = the proportion of the Japan Sea population that are migrants from the Pacific Ocean per generation, m21 = the proportion the Pacific Ocean population that are migrants from the Japan Sea per generation (note that m is the migration rate backward in time); TG = timing of bottleneck, NPO = Pacific Ocean effective population size, NJS = Japan Sea effective population size and NJSB = Japan Sea bottleneck effective population size. Posterior probability density curves for (B) Japan Sea and Pacific Ocean divergence time and timing of bottleneck in the Japan Sea lineage, (C) Japan Sea, Pacific Ocean and Japan Sea bottleneck effective population sizes, and (D) migration rates averaged across the genome, shown as m in Fig 2A. Figures on each panel are median parameter estimates.

