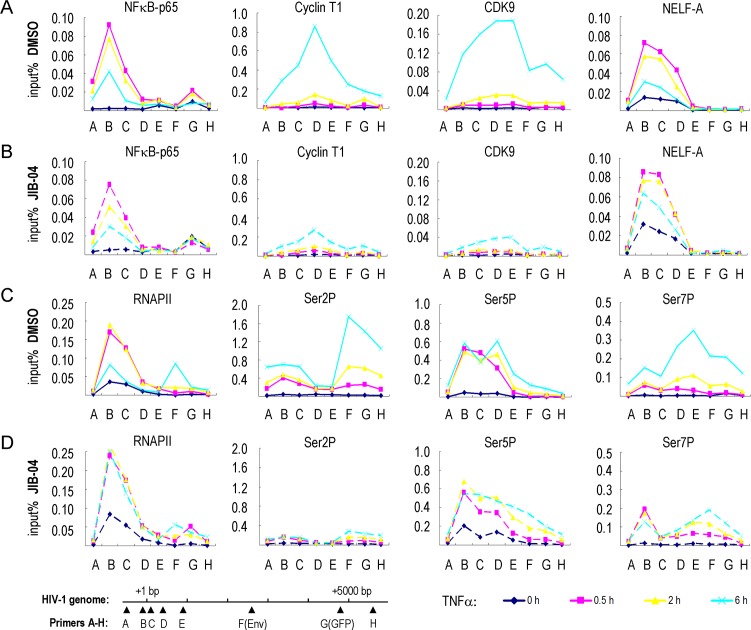
Fig 2. ChIP analysis of the effect of JIB-04 on the binding of transcription factors to the HIV-1 genome.
ChIP analysis comparison of transcription factor binding to the single integrated HIV-1 genome in 2D10 T cells treated either with DMSO (A,C) or with 3 μM JIB-04 (B,D). Cells were treated with TNFα (10 ng/ml) for 0 h (blue line), 0.5 h (pink line), 2 h (yellow line), or 6 h (light blue line). The ChIP values in the Y-axis are expressed as percentage input. The ChIP primers (A-G) that were used are indicated on the X-axis, and their relative location on the HIV-1 genome are shown in the schematic at the bottom left. Antisera used for ChIP antibodies are NF-κB (p65 subunit), Cyclin T1, CDK9, NELF-A, RNAPII CTD, and phosphorylated RNAPII CTD-Ser2 (Ser2P), CTD-Ser5 (Ser5P) and CTD-Ser7 (Ser7P), as indicated above each panel.

