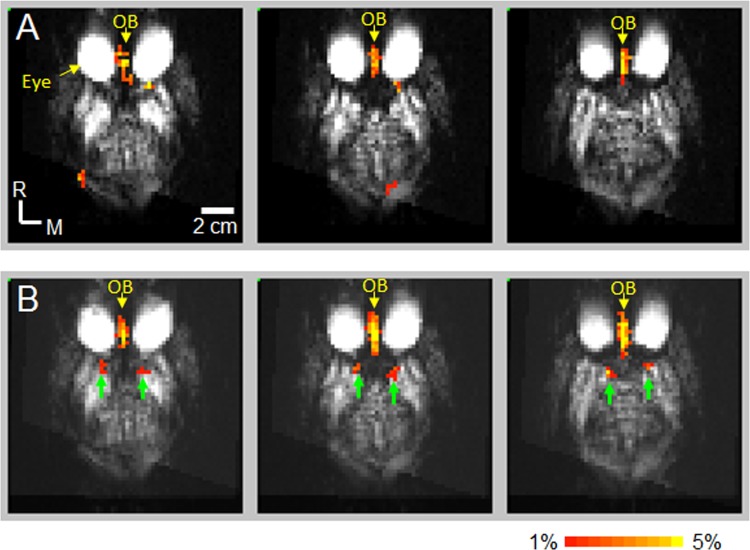
Fig 3. Olfactory fMRI activations before and after MK801 injection.
The data from all NHPs were averaged to map the activations (p < 0.05, cluster size = 4). (A) Olfactory fMRI Activations before MK801 injection. Color-encoded activations (red/yellow) were observed in the consecutive 3 slices where olfactory bulb is located. (B) Olfactory fMRI activations after MK801 injection. Color-encoded activations were observed in the consecutive 3 slices where olfactory bulb and piriform cortex are located. Green arrows: activations in the piriform cortex. OB: olfactory bulb.

