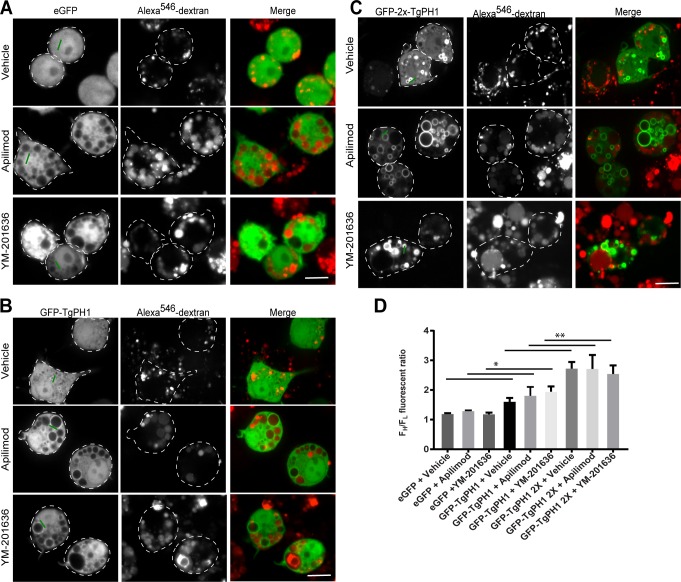
Fig 1. Subcellular distribution of GFP-fused TgPH1 proteins in PIKfyve-inhibited RAW cells.
RAW macrophages were transfected with GFP (A), GFP-TgPH1 (B), or GFP-2x-TgPH1 (C) and lysosomes were labelled with Alexa546-conjugated dextran as described in Methods. Cells were then left untreated (control) or exposed to 20 nM apilimod or 100 nM YM201636 for 1 h to inhibit PIKfyve and induce vacuolation. Cells were imaged live using spinning disc confocal microscopy. GFP-2x-TgPH1 displayed strong membrane association that was retained in PIKfyve-inhibited conditions, while GFP-TgPH1 displayed weaker membrane association and GFP was cytosolic under all treatments employed. Green line exemplifies line arrangements used to quantify FH/FL fluorescence ratio. D. Quantification of GFP, GFP-TgPH1 and GFP-2x-TgPH1 membrane association. Data shown are mean FH/FL ± SD from N = 3 from 25–40 cells per experiment per condition. Using a one-way ANOVA and Tukey's post-hoc test, there was significant difference between the FH/FL for GFP and GFP-TgPH1 for each respective condition (* p<0.05). In addition, there was a significant difference between the FH/FL for GFP-TgPH1 and GFP-2x-TgPH1 (** p<0.01). Scale bar represent 10 μm.

