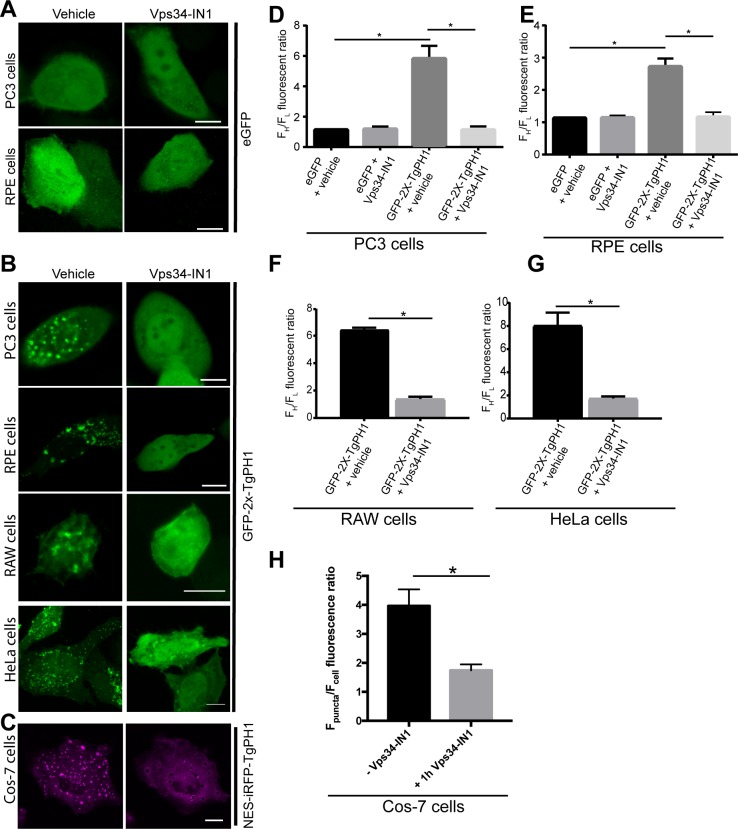
Fig 4. Inhibition of Class III PtdIns 3-Kinase Vps34 displaces TgPH1 domain from membranes.
A. PC3 and RPE cells expressing eGFP and treated with vehicle or 1 μM VPS34-IN1 for 1 h to block Vps34 activity. B. PC3, RPE, HeLa and RAW macrophages expressing GFP-2x-TgPH and treated with vehicle (control) or 1 μM VPS34-IN1 for 1 h. For A and B, cells were fixed and imaged by spinning disc confocal microscopy. C. Cos-7 cells expressing NES-iRFP-TgPH treated with vehicle or 1 μM Vps34-IN1 for 1 h. Cells were imaged by laser scanning confocal microscopy. For B and C, control cells displayed chimeric TgPH1 proteins on punctate structures, while cells treated with Vps34-IN1 exhibit mostly cytosolic TgPH1 distribution. D-G: The proportion of GFP-2x-TgPH1 associated with membranes relative to the cytosol was estimated by quantifying FH/FL fluorescence ratio as described in Methods using a 10-pixel wide and 30-40-pixel long line. H. The proportion of NES-iRFP-TgPH1 in the membrane versus cytosol was assessed by quantifying Fp/Fc as described in Methods. In all cases, these data quantitatively show that GFP-2x-TgPH1 and NES-iRFP-TgPH1 become cytosolic in VPS34-IN1-treated cells in a variety of cell lines. Error bars represent standard error of the mean derived from analyzing at least 20 cells per condition across N = 3 independent experiments. * p<0.05 against respective controls using Student’s t-test for F, G and H or using one-way ANOVA and Tukey’s test for D and E. Scale bars represent 10 μm.

