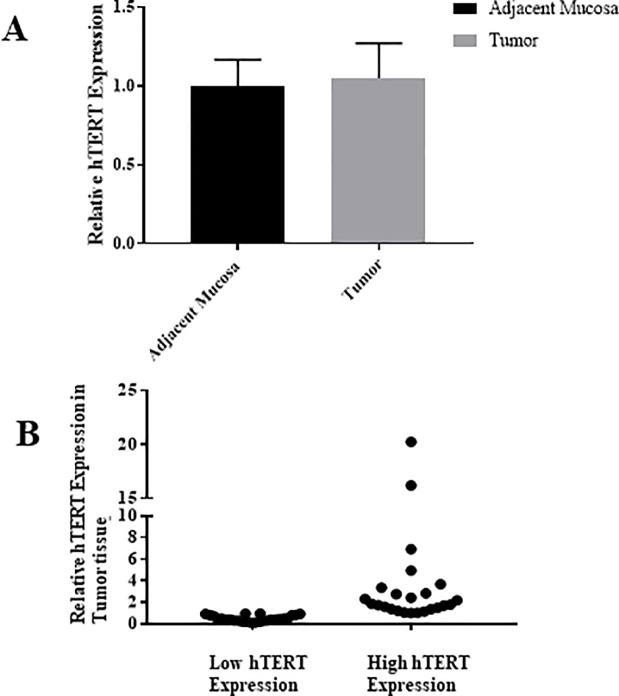
Fig 2. The expression of hTERT in 50 matched CRC tissues relative to the adjacent mucosa.
(A) The mean fold change difference between the matched tissues, showing a non-significant increase in CRC tissues relative to the adjacent mucosa (P value > 0.05). (B) The expression patterns of hTERT in each CRC sample relative to its normal mucosa showing a variation among patients, in which some tumor samples showed low hTERT expression, others showed high expression.

