
Fig. 1.
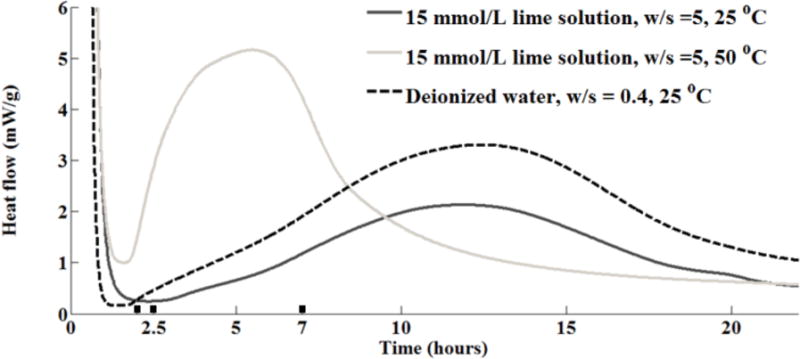
The heat flow from isothermal calorimeter for C3S, in mW/g of C3S based on a single measurement. The bars labeled on the X-axis of the calorimetry curves show the time periods of hydration used in the imaging experiments.
Official websites use .gov
A
.gov website belongs to an official
government organization in the United States.
Secure .gov websites use HTTPS
A lock (
) or https:// means you've safely
connected to the .gov website. Share sensitive
information only on official, secure websites.
The heat flow from isothermal calorimeter for C3S, in mW/g of C3S based on a single measurement. The bars labeled on the X-axis of the calorimetry curves show the time periods of hydration used in the imaging experiments.