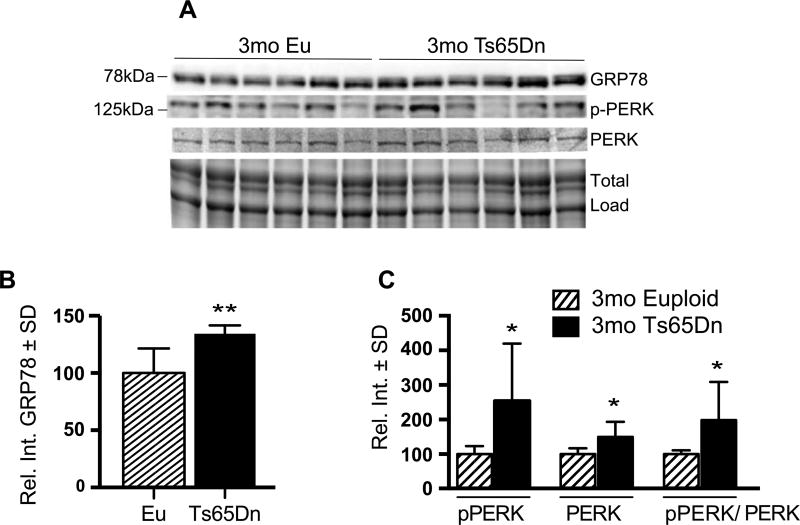
Fig. 2.
Active PERK levels are present in 3mo Ts65Dn mice brains. A) Representative western blot showing increased GRP78 and pPERK (pT981). B) Quantification of panel A showing significantly increased GRP78 levels in Ts65Dn brains. C) Quantification of panel A showing levels of pPERK, PERK, and the pPERK to total PERK ratio. Densitometric values shown in the bar graph are the mean of 6 samples per each group normalized per total load and are given as percentage of Euploid mice, set as 100%. Statistical significance was determined using Student t-test analysis (*p < 0.05, **p < 0.01).

