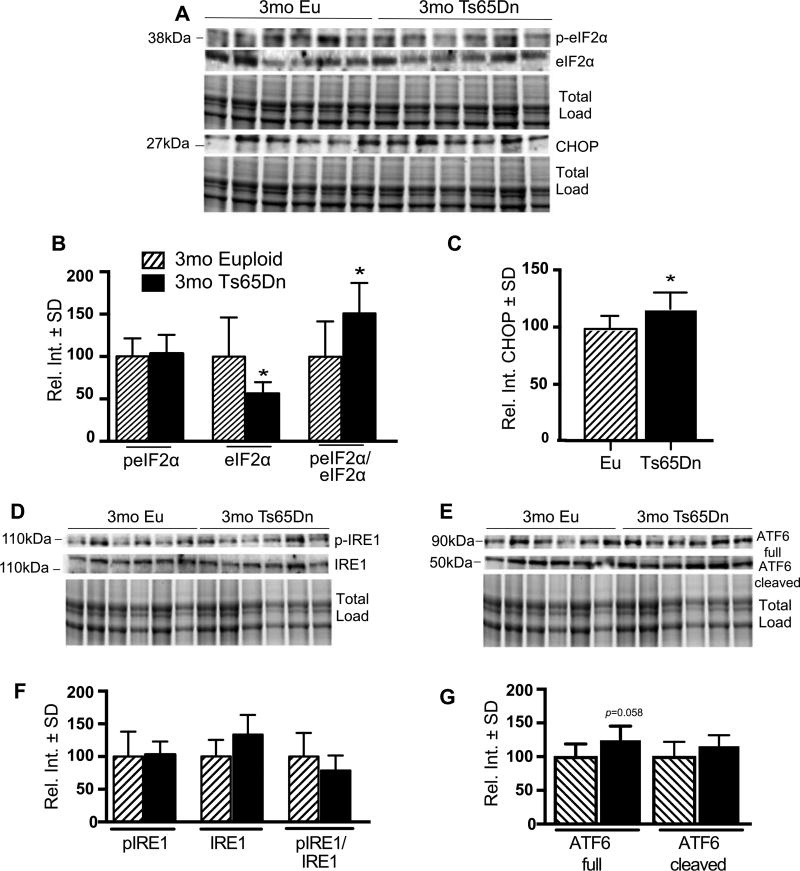
Fig. 3.
3 mo Ts65Dn mice show PERK-dependent CHOP activation. A) Representative western blot showing increased peIF2α (pS51) and CHOP. B) Quantification of panel A showing levels of peIF2α, eIF2α, and the peIF2α (pS51) to total eIF2α ratio. C) Quantification of panel A showing significantly increased CHOP levels in Ts65Dn brains. D,E) Representative western blot showing no change in pIRE1 (S724) and ATF6. F) Quantification of panel A showing levels of pIRE1, IRE1, and the pIRE1 to total IRE1 ratio. G) Quantification of panel E showing levels of ATF6 (Full) and ATF6 (Cleaved) form. Densitometric values shown in the bar graph are the mean of 6 samples per each group normalized per total load and are given as percentage of Euploid mice, set as 100%. Statistical significance was determined using Student t-test analysis (*p < 0.05).

