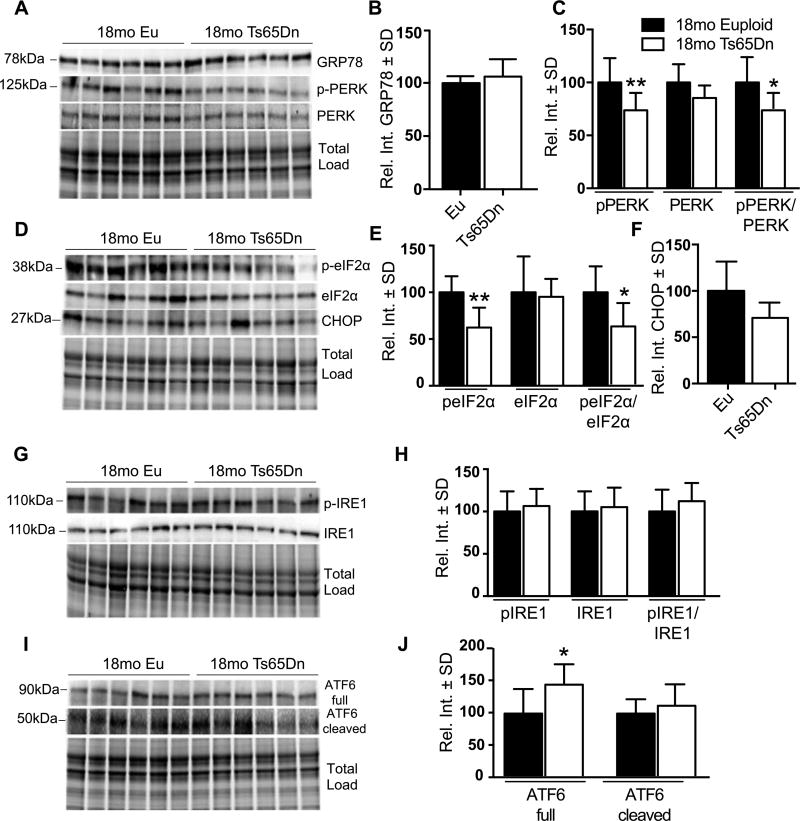
Fig. 5.
PERK-eIF2α pathway is decreased in 18mo Ts65Dn mice. A) Representative western blot showing no change in GRP78 levels at 18 months and decreased in pPERK (pT981) levels. B) Quantification of panel A showing no significant difference in GRP78 levels. C) Quantification of panel A showing levels of pPERK, PERK, and the pPERK to total PERK ratio. D) Representative western blot showing decreased in peIF2α (pS51) and no change in CHOP levels. E) Quantification of panel D showing levels of peIF2α, eIF2α, and the peIF2α (pS51) to total eIF2α ratio. F) Quantification of panel D showing no change in CHOP levels. G) Representative western blot showing significantly increased in ATF6 Full protein and no change in the cleaved form. H) Quantification of panel G showing levels of ATF6 (Full) and ATF6 (Cleaved) forms. I) Representative western blot showing no change in pIRE1 (S724). J) Quantification of panel I showing levels of pIRE1, IRE1, and the pIRE1 to total IRE1 ratio. Densitometric values shown in the bar graph are the mean of 6 samples per each group normalized per total load and are given as percentage of Euploid mice, set as 100%. Statistical significance was determined using Student t-test analysis (*p < 0.05, **p < 0.01).

