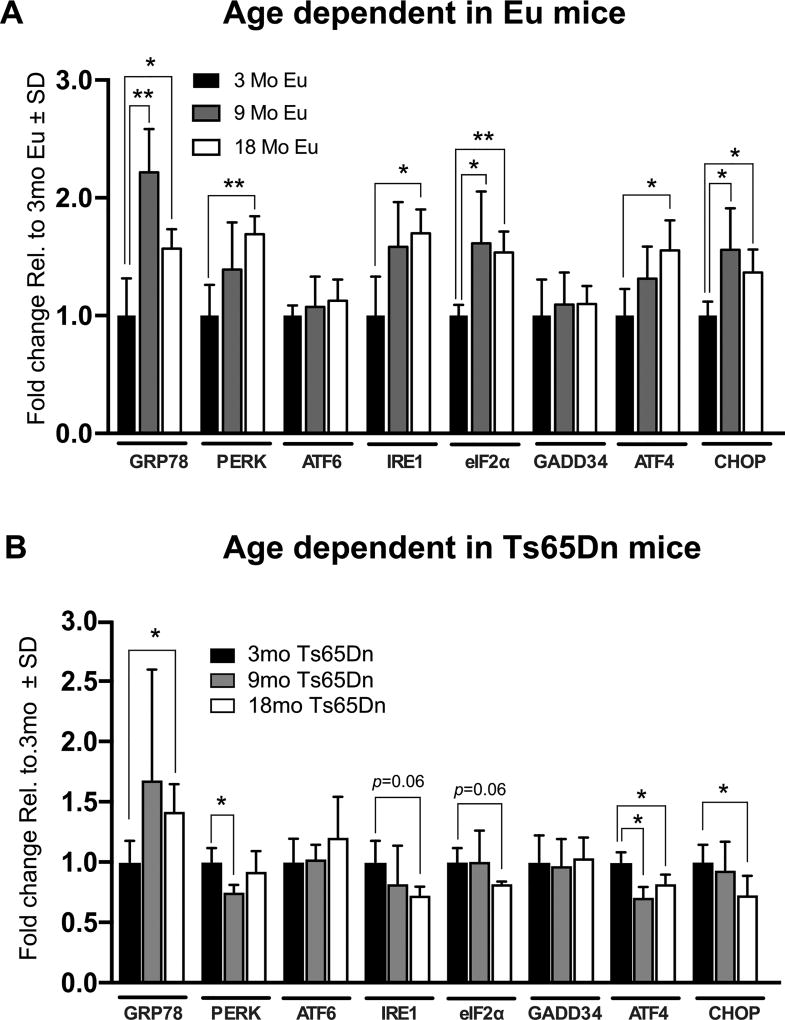
Fig. 6.
Differential UPR activation in Eu and Ts65Dn mice. A) Gene expression of UPR-related genes plotted over time against Eu mice. B) Gene expression changes of UPR-related gene expression in 3, 9, and 18mo. All gene expression data were normalized to GAPDH expression. Fold change was determined using 2(−ΔΔCt) method. Fold change for (A–B) was calculated from the 3mo Ts65Dn mice (A) and from the 3mo Eu (B) which are set to 1. Sample size was six mice per group. Statistical significance was determined using Student t-test analysis (*p < 0.05, **p < 0.01).

